The exit poll results from all five polling locations in Southeast Kansas show strong evidence of election fraud in both the patterns and size of the errors.
I had major concerns with the accuracy of our voting machines based on my previous analyses, which is why these exit polls were run. The results confirm those suspicions.
I designed this exit poll to check whether or not our voting machines are giving us accurate counts. I looked into our local election statistics in the past and found concerning indications of fraud in the data. There is no public official reconciliation of the paper records with the official vote counts provided by machine nor are citizens allowed access to do it. I have the credentials to do this; I have a Ph.D. in statistics and have been certified by the ASQ as a quality engineer since 1987. I was able to recruit enough concerned voters to man the exit polls from open to close on election day.
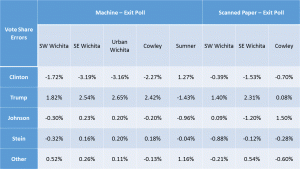
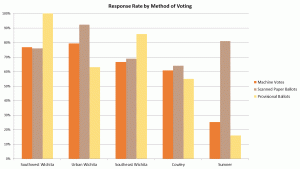
Voters were asked how they voted – by machine, a scanned paper ballot, or an uncounted provisional ballot. Results from the polling location give us the breakdown by machine votes and scanned ballots, which can be directly compared. The electronic voting machines used in all three Kansas counties were ES&S Ivotronic. The paper ballot scanning equipment varied, but was all from the same manufacturer: ES&S.
The results from these exit polls tell a consistent, albeit unpleasant, story: Our electronic voting machines should not be trusted. Scanned paper ballots have been impacted as well, but due to some technical issues regarding the data, results on that type of counting machinery are less compelling. Scanned paper ballot results often continued the pattern of the voting machine results, which does add to the weight of evidence against the accuracy of the official results.
I have posted the data from our exit poll and the corresponding official vote counts at Exit Poll Data
These exit poll results clearly point to manipulation of the machine counts of our votes. These are not random errors. There is no other reasonable explanation for large and consistent errors in favor (or against) particular candidates in this situation.
-
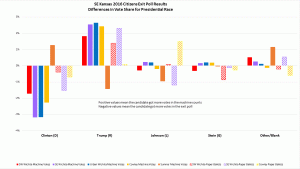
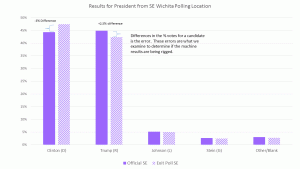
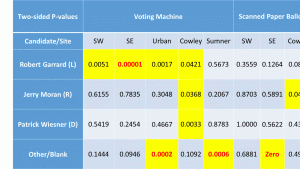
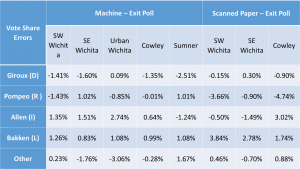
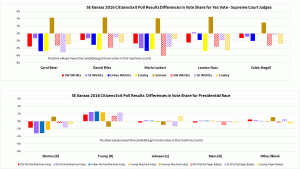
Exit Poll Errors for Presidential Race 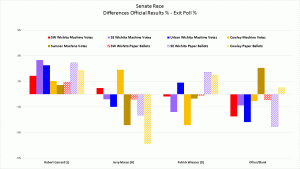
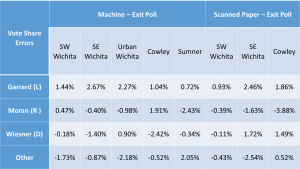
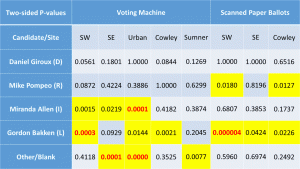
Exit Poll Errors for Senate Race 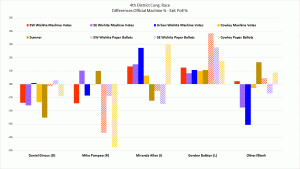
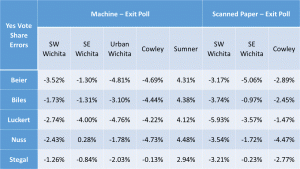
Exit Poll Errors for 4th Congressional Race 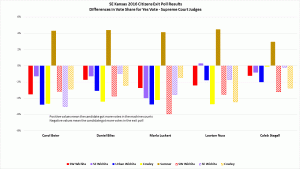
Exit Poll Errors for Kansas Supreme Court Judges by Judge Presidential race results show votes shifted from Clinton to Trump in four of the five locations – all except Sumner County.
- Votes in the Senate and 4th district Rep races were skewed toward the Libertarians at all five exit poll locations.
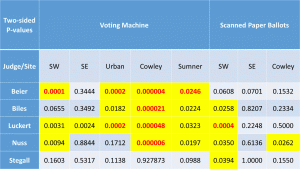
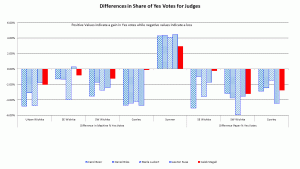
- The data from the Supreme Court Judges show Yes votes stolen in four of the five locations – all except Sumner County, where they received extra Yes votes.
The analysis details are posted at Analysis of 2016 Citizens Exit Poll in Southeast Kansas
There is one ray of sunshine in these results – while the size of the shifts are cause for grave concern about the accuracy of the vote count, they are not sufficient to have altered the outcome in any of the races mentioned above. Kansas was Trump territory. The Judges all retained their positions. No Libertarians won.
This ‘ray of sunshine’ is limited to these results. Races polled at only one or two polling locations look even worse. There was a more than 10% shift in votes from Norton to O’Donnell in the Sedgwick County Commissioner third district race, easily sufficient to alter the winner*. The data from these local races may only affect a portion of the voters at the polling site. For that reason, the data from those races is not as solid. The lower quantity and quality of data in those races reduces confidence in any conclusions regarding the results.
Who’s doing this and How? I don’t know. My analyses shows which candidates lost votes or benefited, but that’s not justification for assuming they are knowledgeable regarding the vote theft. There’s only one conclusion about the perpetrators I can come to.
Multiple Agents – The profile of errors from Sumner County is so different from the other sites, I can conclude that more than one agent successfully altered voting machine counts in S.E. Kansas polling stations.