The post is a detailed analysis of races that were common to all five exit polls linked here: exit poll data
In the absence of election fraud, the difference in vote share between the official count and an exit poll (called the error) will be randomly distributed (both positive and negative) and relatively small. If voting machine counts have been altered, we will see telltale patterns in these error measurements. We can determine if our machine votes are being counted honestly or if some candidates benefit and others are victimized by election fraud. The exit poll results from all five polling locations show strong evidence of election fraud in both the patterns and size of the errors.
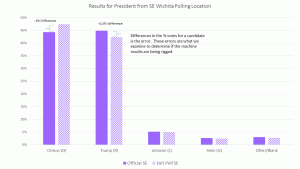
EXAMPLE: The graph above shows the results for the presidential race from SE Wichita. According to the machine totals, Hillary Clinton received 435 votes out of 983 cast on the voting machines there. That’s a 44.25% vote share. Our exit poll data showed Hillary Clinton received 306 votes out of 645 survey responses to this question from voters who cast their votes on those same machines at that polling location. That’s a 47.44% vote share. The difference between those two values, -3.19%, is the error, illustrated in the graph below. This error measurement is computed for each candidate, race, type of voting equipment and polling location.
There were some problems with some of the data. I have included data from all five sites for their electronic voting machine counts. The link above gives the raw data for both voting machines and scanned paper ballots for all five sites, but only three of the five sites had sufficiently high quality data to be included in this analysis. This post discusses what data was left out and why.
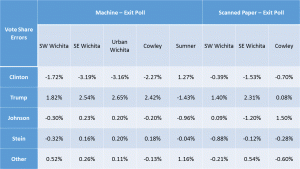
Presidential race results show votes shifted from Clinton to Trump in four of the five locations. The errors for the presidential candidates by site and voting equipment are shown in the table below.
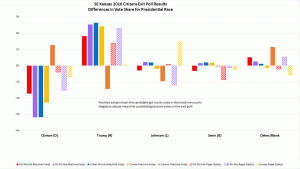
These values are also shown in the chart below. Johnson and Stein errors look random and reasonable. Clinton and Trump errors are much larger and roughly match on the DRE machines with votes shifting from Clinton to Trump in four of the five polling locations.
To statistically analyze the size of errors, use the hypergeometric distribution. This computation is available in EXCEL as HYPGEOM.DIST. It takes into account both the size of the population (total voters in the official count) and the sample size (total exit poll responses) in computing the probability of getting an error as large or larger than our exit poll had. See this post for the technical details about how this computation is done.
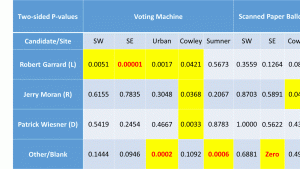
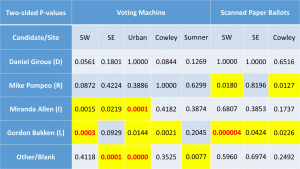
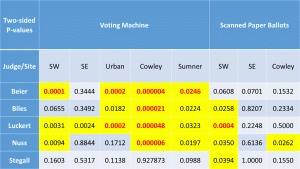
The p-values for two-sided tests are given in tables below. Yellow indicates a statistical flag, a probability of less than 5% occurring if there was no election fraud. Bold red numbers indicate probabilities of less than 1 in 1,000.
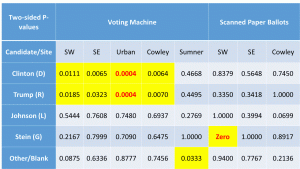
The p-values clearly confirm the initial impression generated by the graph above: voting machine election fraud occurred in four of the five polling locations shifting votes from Clinton to Trump.
One interesting detail – Jill Stein actually received more scanned paper ballot votes in our exit poll in SW Wichita that they recorded at that site. Since that can’t actually happen without errors or dishonesty, that probability is an absolute zero. I wrote out ‘Zero’ to distinguish this situation from 0.0000 which indicates a probability that is below 0.00005 but still above zero.
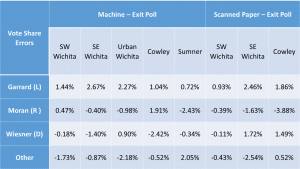
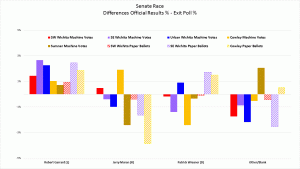
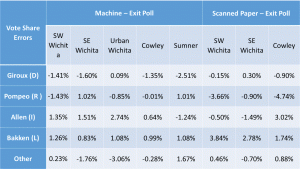
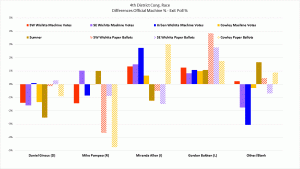
The Senate and 4th district Rep races were skewed toward the Libertarians.
The only pattern in these two races was that the Libertarians ALWAYS benefitted from the errors, with higher machine counts than exit poll percentages. Both Democrat and Republican candidates lost votes, in some cases by suspiciously large amounts approximating the size of the error of another candidate.
Polling locations differed considerably. Sumner county looks as if votes were taken from Moran (R ) in the Senate, but even more from Giroux (D) in the 4th Cong. Dist and undervotes for both races were increased. Independent candidate Miranda Allen for the 4th district benefited by an unusual amount in the machine vote counts in all three Sedgwick County polling locations. These errors look like fraud.
Below are tables and graphs of the errors between the official results and the exit poll results for the Kansas Senate and 4th Congressional Districts and tables of the p-values for those errors.
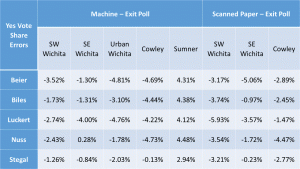
The data from the Supreme Court Judges show the most clarity. The pattern that fits across all five judges cannot be denied. In addition, the magnitude of the errors also exceeds that found in the other three races.
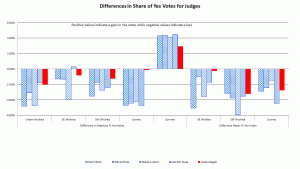
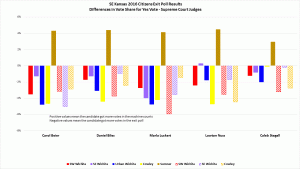
The four Supreme Court judges actively opposed by Gov. Brownback had Yes votes stolen in same four locations that favored Trump. The only positive error is a tiny one for Nuss in the SE Wichita location, with the remaining errors for those four sites all showing negative for all five judges. Sumner, different once again, showed only positive errors (More Yes votes) for all five judges
Stegall, Brownback’s only appointee up for retention, has results identical in direction to the other four, but smaller in magnitude. He has only one slightly improbable dearth of yes votes in the scanned paper ballots in the SW Wichita location. For Stegall, only the fact that his pattern matches the others is a sign of fraud against him. For the other judges, both the size and pattern of the errors testify to the rigging of the official counts by the machines.
Below are tables and graphs of the errors between the official results and the exit poll results for the Kansas Supreme Court Judges Retention Votes and tables of the p-values for those errors. Multiple graphs of the judges are shown, grouping by judge (as previous graphs) and grouping by location. That latter makes it undeniable that all sites show signs of corruption, although not in agreement on the preferred direction. Finally, a graph showing the judges next to a graph of the presidential candidates on the same scale.
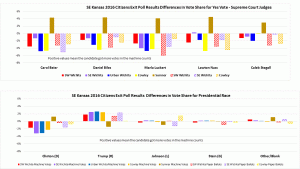
This last comparison, putting the errors for the presidential race on the same scale as the judges, actually startled me when I first graphed it and I was expecting it. The average size of the errors should be approximately the same for all the races since they are all drawing from a near identical sample of voters. To a statistician, this increase in the magnitude of the error for the judges is another flashing red light saying that these machine results have been rigged. Rigged in different ways in different places, but all of the sites with exit polls show the telltale signs of the corruption.
To quote: “The p-values clearly confirm the initial impression generated by the graph above: voting machine election fraud occurred in four of the five polling locations shifting votes from Clinton to Trump.”
I think you should make more of the fact that it was NOT evident at one of the locations. Do you have any sense of what was different in Sumner? Different voting technology? Different population demographics or poll taker demographics? Can the fact that it didn’t happen in the one piece be used in any way to argue that it is NOT just people lying about who they voted for. I don’t believe it is lying, btw, just wondering about what is going on.
Same voting machines – all five sites use Ivotronic machines. Same basic demographics as Cowley. Similar poll takers – i.e. white middle-class middle-aged voters.
No, there is NO reason for the different results other than fraud with the machine counts. Yes, I think it can be used to argue that it is not due to liars who voted Trump and told us Clinton. I don’t understand why people think that’s a good argument in the first place? I do assume liars and idiots are randomly distributed among the parties. I don’t know why assuming the opposite – that liars have a party preference is considered a reasonable assumption? Especially when it’s brought up only to negate the findings that the machine vote counts were rigged for Trump. Even with the assumption, it doesn’t explain the results for the Judges, which had errors twice as large.
unfortunate that the Sumner data were collected by a single person. Just would be nice to see if there were any differences based on who was collecting the data.
There was more than one person. But only 3 or 4 I think. Other sites had two people all day and more during the busiest period.
Hi Beth,
I would like to retract what I said in my earliest e-mail to you. It was written shortly after I heard you present your data and before I had spent much time thinking about it. The example was a red herring and the analysis premature.
Annie