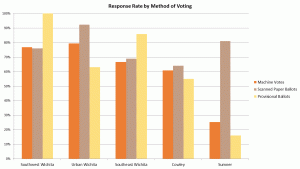
ALL of the raw data from all five exit polling locations has been posted. However, I had concerns about some of the data collected and that I will not be including it in my analysis at all. This is not unusual in any research endeavor. Prior to analysis the data must be vetted for accuracy and validity. I exclude data from my analysis when I feel including the data could lead to erroneous conclusions regarding election fraud occurring.
I am not including the scanned paper ballot survey data from the Urban Wichita and Sumner County sites. eta: The Cowley County Paper Ballot data is also being excluded. See update at end of post. The reason is that when I look at the response rate for the different methods of voting, I see signs of potential problems at those two locations.
I am concerned with the relatively low response rate for provisional ballots and relatively high rate for the scanned paper ballots. I suspect that in those two sites, some provisional voters mistakenly indicated the scanned paper ballot. This was a relatively easy mistake for voters to make; they might not be tuned into the difference between them.
Since one hypothesis I’ll be testing later is whether or not the provisional voters’ choices were different from the counted ballots, this concern renders the data from those sites as inconclusive. Under this circumstance, voter error is a reasonable alternative explanation to election fraud for any statistically significant differences. Because my main concern is with the voting machine results, I decided not to include the results for the scanned paper ballots from those two sites in my analysis. I may revisit this assumption later if the provisional votes are not found to be significantly different from the votes that were counted.
On the other hand, since the leakage appears to shift voters from provisional to scanned paper ballots, the data from provisional voters can be considered representative. However, only the Urban Wichita provisional data will be analyzed because the Sumner County provisional sample had only 13 surveys; not large enough to draw any conclusions from.
I am keeping the provisional surveys from the SW and SE locations even though had much higher rates of provisional voters, with the SW location claiming 101% response rate, with one more provisional survey than the official count. Clearly we had at least one confused survey taker. But since the response rates for the machine and scanned paper ballots are similar in those cases, my assessment is that people who voted provisionally were simply more likely to complete one of surveys. They were worried their official vote wouldn’t be counted. One such voters complained bitterly to us about it while filling out our survey. Suddenly, their name had simply vanished from the registration books despite having voted there regularly in the past! One of our volunteers had the same experience. This excess of provisional voters does not seem likely due to contamination from the scanned paper ballot voters, so the data from provisional voters can be considered representative.
Blanks – They’re a technical issue for surveys. There are two sorts of blanks with respect to survey responses. A survey taker might not indicate an answer on one or more questions. These were coded NR (No response) and were not included in any further analysis. Valid responses to other questions were retained. Overvotes on any question were treated the same.
We included ‘Write in or left blank’ as an option to the candidates as much as possible. Space on the survey form was at a premium, and some site managers deciding against including it on all questions. I insisted on it for the questions asked on all surveys. I felt it of particular importance for the presidential election given the candidate selection. For those three questions, people who didn’t answer that question are removed from the sample, but we can compare the rates for write-in or left blank with the number of write-ins and undervotes on the official results. For other questions, including the judges, undervotes and ‘write-in or left blank’ are taken out of the sample and all subsequent computations unless specifically stated otherwise.
These choices do affect the p-value computations of the hypergeometric distribution given in my tables.
ETA: Cowley County Paper Ballot Data removed from original analysis
On Feb 11th, I spoke with the Women for Kansas Cowley County (W4K-CC) Meeting. We discussed the results of the exit poll they had run on Nov. 8th. The Karen Madison, the Cowley County county clerk/election officer was there and made some details about their data aggregation method I was previously unaware of. The totals for the Cowley County Mail In Ballots are included with totals for the Paper Ballots cast on election data at the polling location. I does NOT include provisional ballots, but the inclusion of the mail-in ballots in those totals makes it no longer an apples-to-apples comparison as at the remaining two Wichita sties.
As a result, I have removed that dataset from my upcoming peer-reviewed publication. I have decided to leave my original blog post unchanged while updating this post and discussing the implications of removing the data in a future post. I will post details regarding publication of my paper once they are finalized. It will be available on-line on an open access journal site prior to publication on paper this summer.

Have you ever considered writing an ebook or guest authoring onn other sites?
I have a blog centered on thhe same subjects you discuss and would rezlly like to
have you share some stories/information. I
know my readers would appreciate your work. If you’re even reemotely interested, feel free to shoot me
an e mail.
Hi there, I enjoy reading through your article. I wanted
to wrige a little comment too support you.