The Show Me The Votes Foundation sponsored five citizens’ exit polls in S.E. Kansas to assess the accuracy of machine vote counts. The results of these citizens exit polls provide tangible evidence of election fraud in the presidential race. I designed the exit polls explicitly so they would provide evidence of election fraud should any be present. The only better evidence would be an audit showing the discrepancies in the actual ballots. But audits of the voting machine results are not allowed in these Kansas counties.
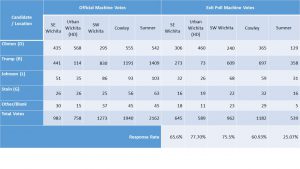
Exit polls – taken as people are leaving the polling place – are extremely accurate at capturing the vote share of candidates. Staffed by volunteers from the polls open to their close, we achieved outstanding response rates. These are shown in the table below.
eta: after final counting, the SW Wichita votes for Trump changed from 609 to 611.
Polling Station and Exit Poll Results
A rule of thumb is that 2% or larger difference in vote share between the official results and the exit poll is evidence of election fraud worth investigating. We had such excellent response rates at some of our sites that differences significantly smaller than 2% are considered suspect in some races.
In addition, we can take into account the overall composition of differences between the official results and the exit poll statistics for each site. For example, at the Wellington polling site in Sumner County, all Republican candidates had lower vote share in the machine counts than in the exit polling results. This consistency is suspicious even though the differences may be small.
The exit poll results indicate that our machine generated counts are being manipulated. Polling sites in Sedgwick and Cowley counties were manipulated for the benefit of some candidates, most notably Trump at all four of those sites. Results in Sumner County appear to be manipulated to the detriment of Republican candidates – but not necessarily to the benefit of Democrat Candidates. Libertarians performed better in the machine counts for both the Senate and the 4th District races than exit polls indicated for all five sites. These differences are not sizable enough to alter the outcome of most races, but they are consistent and larger than expected by chance alone. I’ll post more about those results as I do a more detailed analysis for each polling location.
Presidential Race Analysis:
Votes for Hillary Clinton were shifted to Donald Trump in four of the five polling locations we surveyed, Sumner being the exception. This chart shows approximately 2% to 3% of the machine votes were shifted from Clinton to Trump at those sites, adding 4% to 6% of the vote share to the difference between them to benefit Trump. The other candidates show only normal error rates.
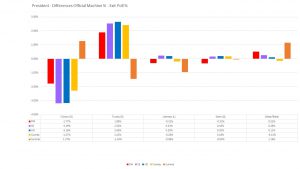
Figure 1 – This graph shows the difference between the machine vote share and the exit poll vote share for each candidate at each site. Positive values show that the machine count benefited that candidate. Negative numbers indicate a loss compared with the Exit Poll results.
Sites in Sedgwick and Cowley Counties show a distinct bias with the machine counts siphoning votes from Clinton and benefiting Trump. Sumner County exit poll results for the Clinton and Trump were not statistically significantly different from the machine counts for Sumner County.
Since Trump won Kansas with 54% of the vote to Hillary’s 36%, even assuming this shift held across Kansas (it didn’t), it was well below Trump’s margin of victory, so this manipulation of votes did not alter the outcome. Still, it is disturbing evidence that the machine vote counts are being altered. In other states, which use similar equipment, manipulation at this level could have changed who won the Presidency.
Statistical Details
I computed the exact probability of each candidate getting the vote share they received in our exit poll given the official counts for that polling location. This was computed using the Hypergeometric probability distribution, which takes into account both the size of our exit poll sample and the number of people who cast votes at that polling location on Election Day.
This probability – or p-value – is the exact computation of the probability of getting our exit poll results assuming no election fraud occurred. The p-values for the different presidential candidates at each of the five exit poll sites are given in the table below.
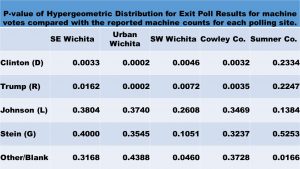
The p-value represents the level of concern about the official results given our exit poll results with 1.0 indicating everything’s normal, nothing of interest here and zero indicating Red Alert Danger Will Robinson! Danger! The computed p-values always fall somewhere in-between.
The probabilities for Johnson and Stein are all quite reasonable and raise no serious alarms regarding the accuracy of their vote counts. The probabilities for Clinton and Trump, on the other hand, are low enough to sound alarms for four of the five polling locations.
These exit poll results more than justify a call to audit the voting records and a profound skepticism in the results of machine counted votes.
The Cumulative Vote Share (CVS) Model is Validated as a Sign of Election Fraud
The math underlying this model dictates that this trend should level off horizontally, not start moving in the opposite direction. It means the trend is not random chance, but due to a specific cause correlated with precinct size. It is such unanticipated trends as revealed by this type of graph that motivated me to look more closely into our vote-counting process, eventually leading to conducting the exit polls in this past election.
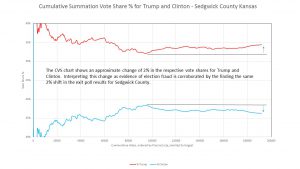 This is CVS graph for Sedgwick County. It shows Trump getting an increase of ~2% of the total vote share and Clinton losing that same amount from their respective inflection points at around 93,000 cumulative votes. These exit poll results vindicate the use of the cumulative vote share model in assessing probability of election fraud.
