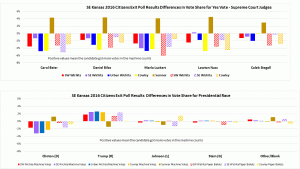
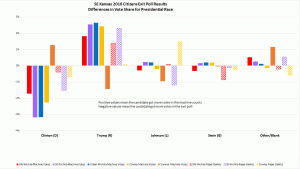
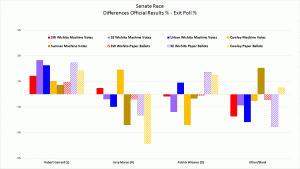
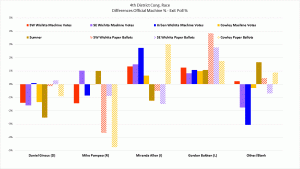
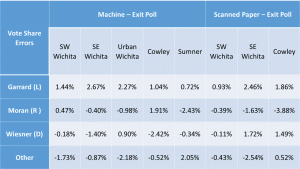
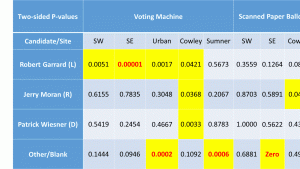
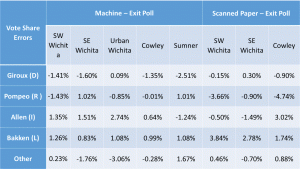
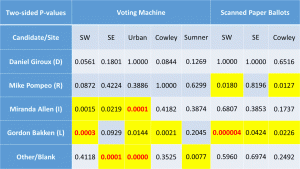
How can I be so sure? Couldn’t there be some other cause of the bias? That was the most common inquiry at my presentation Saturday, when I explained my exit poll results to the people who helped collect the data and had a vested interest in understanding the results. I may have come across as a bit defensive in regard to this question. I’m sorry if I did. It’s hard to articulate the depth of my certainty, but I’ll try.
I carefully set up these exit polls to compare the official vote count by machine type. The only legitimate concern regarding the meaning of these results is a biased sample. Not everybody tells the truth. Some people delight in giving false answers to surveys. How are you going to account for that? It’s a fair concern.
While I cannot prove that didn’t happen (at least, not without access to the ballots, which isn’t permitted), this is part of the normal error I expect. It always helps to state assumptions explicitly.
INTROVERTS, LIARS, AND IDIOTS ASSUMPTION : THESE TRAITS ARE RANDOMLY DISTRIBUTED AMONG ALL CANDIDATES AND POLITICAL PARTIES. I am assuming that that people who were less likely to participate (introverts) or more likely to fudge their answer (liars) or make mistakes (idiots) in filling out the survey did not differ in their response to our exit poll.
I received the following email that sums up this concern nicely and also suggests a couple of ways to check that hypothesis.
Hi Beth,

The observed discrepancies between official results and your poll results very clearly show that Clinton (D) voters were more strongly represented in those polled than in the official vote count; Trump (R) voters were less well represented.  There are  many possible explanations for this discrepancy.  One hypothesis is that a certain percentage of voters “held their nose and voted for X”  and would never have participated in the poll.  If these voters tended to be more of one party than the other, than that party would be less represented in the polls.

Fortunately, your data provide a means to test this hypothesis about the “missing minority”, for it leads to this prediction:
If a “missing minority” was biased towards X, then sites at which X had a greater percentage of the votes would be least affected by vote disparities.

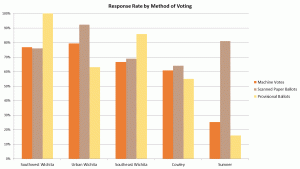
A corollary prediction:  sites having the highest response rate would be least affected by vote disparities.

Have at it!
Annie
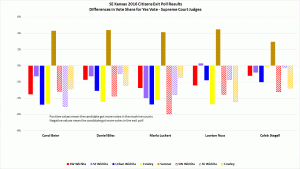
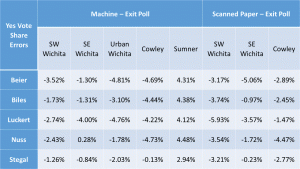
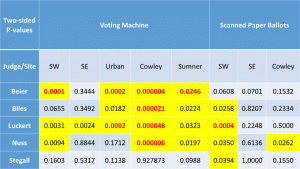
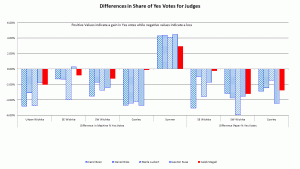
The main reason I find this hypothesis implausible is that the discrepancies for the Supreme Court judges were twice as large and followed the same pattern as the Pres. race discrepancies. There’s no reason to think more people ‘held their nose’ for judges than president!
Regarding those two predictions:
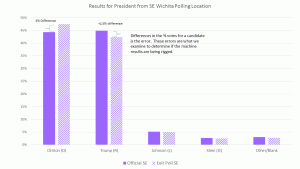
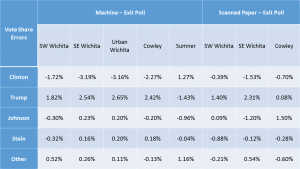
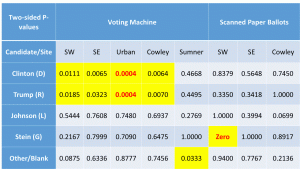
- The sites with the greatest discrepancies were machine counts for SE Wichita, Urban Wichita and Cowley. The sites with the highest %Trump voters were Cowley, SW Wichita and Sumner. No correlation there.
- The site with the lowest response rate, Sumner with 25%, also had the lowest discrepancies between the exit poll and the official results for the Pres. race.
In short, we do not see the other data relationships we would expect if the introverts liars and idiots assumption were false. There is no reason to assume these individuals were more likely to vote for one candidate than another resulting in the bias in our data.
