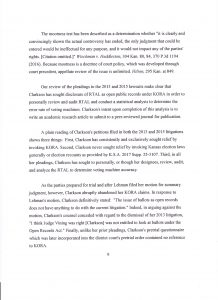
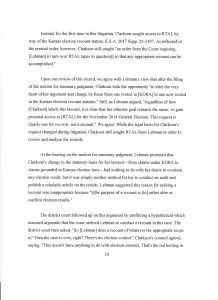
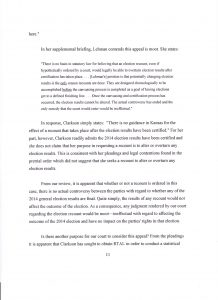
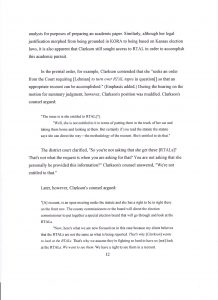
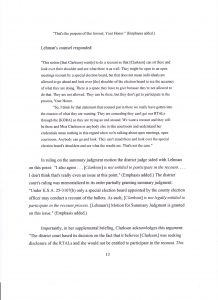
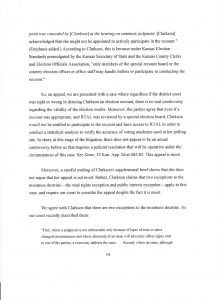
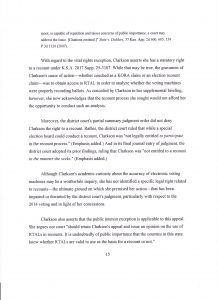
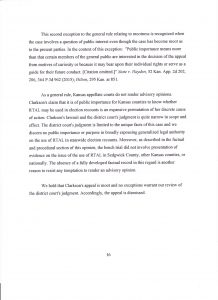
The Appeals court said no. My attorney phrased it this way “This is a disappointing result.” I want to commend Randy Rathbun for his handling of this suit. He has been nothing but professional, providing his excellent services entirely pro bono on this effort.
Category: Uncategorized
A Day at the Legislature
Friday, I took vacation time from work and spent the day listening and testifying at the Oct 27th meeting of the Joint committee on Ethics and Election in Topeka. I want to thank all the people who have donated to the Show Me The Votes Foundation. While the travel expenses are small, the knowledge that I don’t have to take on the costs personally and that I am speaking for others as well as myself provides significant motivation for me to do this.
The majority of the day was scheduled with people from non-profit agencies talking about the joys of Ranked Choice Voting. They were all very professional and did a decent job of covering the cons as well as the pros. I actually found it all fairly interesting. It turns out that one of the unintended consequences of ranked choice voting was a decrease in negative campaigning because insulting an opponent supported by a voter doesn’t incline that voter to making you their second choice. A big plus for the method in my opinion, but that opinion was not shared by all of the committee members.
One senator was confused by a technical detail regarding a theoretical situation that could result in a sub-optimal outcome (one of the cons presented). I don’t think the presenter quite managed to understand his confusion well enough to alleviate it. My take on it was that the senator didn’t realize that in the ranked choice system, a guy who is ranked 3rd is presumed to beat the guy ranked 6th if they were in a head-to-head match-up. This is a reasonable assumption in ranked choice voting because we are referring to the choices of an individual voter. Election outcomes are well established as potentially intransitive in 3-way versus head-to-head matchups, so it was not an unreasonable question for the senator to pose. (Intransitive relations are situations where A > B and B > C does NOT imply A > C)
Understanding and illuminating those underlying assumptions can be difficult. This case involved a deeply buried mathematical assumption about the elemental structure of the data and the answer that justifies it relates to a technical detail regarding the data collection in this context. I have been on both sides of such mathematical confusion, so I could sympathize with both. It’s not easy to identify the buried assumption that isn’t shared.
There were two other Kansans, both with math backgrounds, who testified about ranked choice voting. I was nominally in favor of it. Ranked choice voting is a method with a higher probability of providing a government representative of the majority will of the voters. It’s also more complicated to compute and may require substantially more time to arrive at a winner. As far as I’m concerned, it’s putting lipstick on a pig if they don’t address the elephant the room regarding voting machines, which is what I was there to tell them about.
I told the committee flat out that my research, currently under peer review, show that our machines are being manipulated and they needed to do something about that. I could be proved wrong with an audit, except … no audits allowed.
I complained about the fact that in Sedgwick County we have a brand new expensive voting machine system with a paper trail. Our election officials insist that without a legislative solution, those ballots may never be opened and reviewed by human eyes to verify the accuracy of the count. Which is pretty much what the appeals court judge told me back in September when I asked what voters could do to hold our officials accountable. I think I made it clear to the committee that the current situation was unacceptable.
They mentioned an audit bill that got passed last year. I made it clear that audits were not enough! We need transparent accurate counts election night*. Audits only tell us how off the results were and predict if outcomes were impacted. They don’t fix anything and they don’t prevent anything. We have to do that part too.
I am writing the ideas I hope I conveyed. I’m more eloquent on the internet that I am in person. I was dorky and awkward as always. I’ve accepted that about myself and my usual audience (engineers and/or math students) are fairly tolerant of my missing social cues as long as my math is good. But this was not my usual audience.
I got chided by the Chair about speaking off-topic. I got a lecture by Senator Miller about the unreliability of exit polls – which included a well-delivered “ma’am” that shut me off when I tried to interrupt him. Senator Faust-Goudeau, who had encouraged me to come, publicly thanked me for my testimony.
A few ladies from the League of Women Voters and Representative Elizabeth Bishop from my district came and sat in on my speech for moral support. All-in-all, it went about as well as talking about the elephant in the room usually does.
Rather than making a break for the door and heading home as soon as I finished my testimony, I swallowed my introvert instinct and hung around until the session was over and spoke with some of the committee members afterwards.
Sen. Miller expressed how he agrees with me about the audits. I acknowledged that audits are better. They were my first choice after all. He doesn’t think that exit polls should be taken seriously but acknowledged it’s the best data available to Kansas voters.
Senator Faust-Goudeau asked me to help prepare a bill to get the transparency we need to have confidence in election outcomes. She has given me a spark of hope that if I work at it, change might happen. She is one awesome lady! We are very lucky to have her working for Kansans.
*I wish I had thought to say whenever the winners are announced. One of the cons of the Ranked Choice Voting system is that it may require a couple of days to collect and compute the winner of a statewide race done with that system in place. It’s a drawback I could live with to get more representative outcomes in our elections.
A Tale of Toms, Dicks, and Harrys
For new readers, I am discussing the analysis of Exit Poll Results for S.E. Kansas in 2016. These exit polls were performed because official audits are not done and independent audits are not permitted. It is therefore the best information that I, as a voter in Kansas, have been able to obtain to make an independent assessment of the accuracy of their official vote totals as certified by our elected officials.
My assessment is our voting equipment was rigged! Not by enough to sway the outcome of the elections I had adequate data on, but the official results showed differences from our exit poll results by site that were too consistently in one direction to be anything other than deliberate.
I recently received a harsh but relatively accurate and detailed review of my exit poll paper. The overall judgement was that I need to take the passion and conviction out of my conclusions in order to make it acceptable for a peer reviewed publication. I must admit, I have allowed my passion to seep through, which is generally frowned upon in scientific papers. I will rewrite it.
It is difficult to be dispassionate because this is very personal for me. I was born in Wichita Kansas. I ran the exit poll booth at my personal voting station, as did all of the site managers. We are not doing this for fun and glory; I was able to get the volunteers needed to run five locations because enough people agreed with me regarding my concern about the accuracy of our official counts and were willing to spend the time and energy necessary to accomplish it. If I want to see these results published in an academic journal, and I do, I have to tone down the anger that has bled into my writing about it.
The “Liars, Idiots and Introverts” section received some particularly scathing comments. The reviewer found it offensive. I’m not surprised, it was designed to be offensive. But he/she’s right that it’s inappropriate for an academic journal. This section was written when I was feeling particularly frustrated by people disregarding my results by claiming sampling bias – i.e. people choosing not to participate or deliberately answering incorrectly.
There is also a possibility, that I did not discuss, of inadvertent error in ballot design causing a significant number of voters to err in the same way. The Butterfly Ballot used in Florida during the 2000 election is an example of this type of error.
If I want to convince other people that other explanations are insufficient to explain the discrepancies, I need to do a better job of it. In the end, it is a subjective evaluation of the relative probabilities of the possible explanations. I cannot prove which one is correct. No one can. I think the probability of these results being due to sampling bias is too low to sway my assessment that our voting machines are rigged. Here is another attempt to communicate my reasoning as to why I feel that way.
The Tale of Toms, Dicks and Harrys.
Tom is my name for folks that voted for Trump, but didn’t want the family member or neighbor, who was filling out their own survey standing next to him/her, to know that. Or maybe Tom is a trickster who delights in giving pollsters wrong answers. Or maybe he/she just dislikes taking exit polls. To see the results we did, we had many Toms that either lied to us about it, claiming Hillary instead , or just refused to fill out our survey.
Dick is my name for folks that voted for the Libertarian Candidate in the Senate and 4th Congressional Races, but didn’t want the family member or neighbor, who was filling out their own survey standing next to him/her, to know that. Or maybe Dick is a trickster who delights in giving pollsters wrong answers. Or maybe he/she just dislikes exit polls. Dick either lied to us about it or refused to fill out our survey.
Harry is my name for folks that voted for the Miranda Allen, independent candidate in the 4th Congressional Race on a voting machine but didn’t want family member or neighbor, who was filling out their own survey standing next to him/her, to know that. Or maybe Harry is a trickster who delights in giving pollsters wrong answers. Or maybe he/she just dislikes taking exit polls. Harry either lied to us about it or refused to fill out our survey.
Finally, we get to the judges. We need two more sets of voters to explain the results for the judges as due to sampling bias. I’ll call them Johns and Joans. Johns voted against all the judges while lying or refusing to take our survey and live in Wichita and Winfield but not Wellington. Joans only live in Wellington and wanted to keep the judges while lying or refusing to take our survey. Apparently, we have nearly twice as many Johns and Joans as we have Toms Dicks and Harrys.
What is the probability that all the Toms, Dicks, Harrys, Johns and Joans in S.E. Kansas are responsible for the bias in our exit poll results, rather than deliberate machine manipulation or rigging of the machines? This is a valid question to ask. We can examine our data and see which explanation is a better fit to the data.
There’s a stereotype of Libertarians as anti-social jerks. If this were accurate, it might be a reasonable alternative for the Libertarian results – a lot of Libertarians are Dicks. On the other hand, how likely is that in Southeast Kansas, home of Koch Industries, that a few libertarians independently (or possibly even in cahoots) successfully hacked the voting machines here?
Why is Wellington devoid of Tom’s?
Why are Harrys found only in Sedgwick County and why do they disdain the use of Paper Ballots? Is it more likely that a statistically significant percentage of Miranda Allen’s voters in Sedgwick County, but not Sumner or Cowley are Harrys? This pattern does fit the explanation of a “butterfly ballot” type problem, as it shows up in only one county and on only one type of voting equipment. It is possible that Sedgwick County officials inadvertently programmed the voting machines to somehow cause voters to accidentally indicate Miranda Allan rather than leaving the 4th congressional district race blank as they reported to us. Or maybe Miranda Allen has a fan in Wichita possessing the wherewithal to successfully hack the voting machines in Sedgwick County?
Now consider the relative probabilities of the two alternative hypotheses. What is the probability of all the Toms, Dicks, Harrys, Johns and Joans existing in the numbers required to produce the discrepancies we found in our survey results versus the probability that some nefarious and technically competent people were able to access voting equipment or software and made unauthorized changes to the software?
Here’s a recent opinion piece on that topic published in Scientific American. “Nevertheless, it has become clear that our voting system is vulnerable to attack by foreign powers, criminal groups, campaigns and even motivated amateurs.”
I will say that the probability that Libertarians have more than their fair share of Dicks everywhere is harder for me to reject than the existence of all the Johns and Joans. But accepting that as a viable explanation also embodies some assumptions about the character of Libertarians I am loath to accept.
Until I see evidence that Libertarians actually have these traits in greater numbers, I assume that the tricksters, introverts and idiots are randomly distributed among the various political parties. Other people can and do differ in their willingness to accept that assumption.
Now, this Tom Dick and Harry story won’t go into my paper. It’s not stuffy enough for an academic journal. I found writing it to be helpful in getting to a concise statement of why I feel sampling bias doesn’t work as a reasonable explanation for the exit poll results. I hope my readers find it helpful in understanding my thinking as well.
In fact, writing it has allowed me to add the last bullet to the set of arguments I’m working on for my revised paper. In Bullet form, here are my reasons for concluding that my exit poll results prove deliberate fraud and that sampling bias and inadvertent ballot or survey errors are not sufficient to explain the data.
- No verification of machine results are allowed.
- While a Cumulative Vote Shear (CVS) analysis does NOT prove fraud. CVS analysis applied to Kansas statewide race results have been consistent with the hypothesis of fraud favoring Republican candidates.
- An exit poll of voters compared to machine results matches the size of the difference revealed by the CVS analysis for Sedgwick County.
- Wellington results are consistently biased but significantly different from Wichita and Winfield. Demographically, Wellington is nearly indistinguishable from Winfield, very similar to SW Wichita and very unlike Urban Wichita. This points to hacking.
- Non-response bias requires too contrived a set of voters to be considered plausible while ballot design flaws would be limited to a single county and type voting equipment.
Update on Exit Poll Results
On Feb 11th, I spoke with the Women for Kansas Cowley County (W4K-CC) Meeting. We discussed the results of the exit poll they had run on Nov. 8th.
I discovered that the Cowley County Paper Ballot Official Results are not a apples-to-apples comparison as they are in Sedgwick County. Those results are not suitable for inclusion in my analysis.
They are not the only dataset found to be unsuitable for inclusion. I have removed that dataset from my upcoming peer-reviewed publication. I have decided to leave my original blog post unchanged while updating my post discussing excluded data.
I understand why people don’t pay attention to statistics. They can easily be twisted to yield any result desired by management. That happened in Flint Michigan.
On the other hand, there are legitimate reasons to eliminate data when it is found to be unreliable. The Cowley County are such an instance. The numbers given include main in ballots cast in those precincts.
Another reason I have chosen to leave the original graphs up is that they nice demonstrate the difference in pattern between a randomly introduced source of variation and a consistent bias which is evidence of fraud.
Cowley County results had me scratching my head. The machine results showed trends similar to Wichita. The paper ballots showed only large errors, but benefiting a random scattering amongst the candidates and races. If you are interested in this sort of analytical details, feel free to go through the charts and decide for yourself. I can’t rule out fraud for that dataset, but I don’t know what caused the deviations. If it was fraud, it was either mercenary selling votes to any candidate or multiple agents working at cross purposes purhaps? But given that the data collection limitations imposes greater variability which would result in the pattern of errors we see in those graphs, fraud is not be the most probable cause for those deviations.
Datasets are sometimes tainted by problems that have nothing to do with the question being asked but due solely to constraints on the data available. There are limitations imposed by the methods of both the official results and the exit poll survey. I’m publishing ALL of the raw data, as well as as detailing what data is excluded and why. Anyone who cares to may look at what is being left out as well as decide for themselves if the reasoning for the exclusion is sound. With the exception of the Cowley County data, the other excluded datasets tend to support the fraud hypothesis.
How can you be sure that the voting machines in southeast Kansas were rigged?
How can I be so sure? Couldn’t there be some other cause of the bias? That was the most common inquiry at my presentation Saturday, when I explained my exit poll results to the people who helped collect the data and had a vested interest in understanding the results. I may have come across as a bit defensive in regard to this question. I’m sorry if I did. It’s hard to articulate the depth of my certainty, but I’ll try.
I carefully set up these exit polls to compare the official vote count by machine type. The only legitimate concern regarding the meaning of these results is a biased sample. Not everybody tells the truth. Some people delight in giving false answers to surveys. How are you going to account for that? It’s a fair concern.
While I cannot prove that didn’t happen (at least, not without access to the ballots, which isn’t permitted), this is part of the normal error I expect. It always helps to state assumptions explicitly.
INTROVERTS, LIARS, AND IDIOTS ASSUMPTION : THESE TRAITS ARE RANDOMLY DISTRIBUTED AMONG ALL CANDIDATES AND POLITICAL PARTIES. I am assuming that that people who were less likely to participate (introverts) or more likely to fudge their answer (liars) or make mistakes (idiots) in filling out the survey did not differ in their response to our exit poll.
I received the following email that sums up this concern nicely and also suggests a couple of ways to check that hypothesis.
Hi Beth,

The observed discrepancies between official results and your poll results very clearly show that Clinton (D) voters were more strongly represented in those polled than in the official vote count; Trump (R) voters were less well represented.  There are  many possible explanations for this discrepancy.  One hypothesis is that a certain percentage of voters “held their nose and voted for X”  and would never have participated in the poll.  If these voters tended to be more of one party than the other, than that party would be less represented in the polls.

Fortunately, your data provide a means to test this hypothesis about the “missing minority”, for it leads to this prediction:
If a “missing minority” was biased towards X, then sites at which X had a greater percentage of the votes would be least affected by vote disparities.

A corollary prediction:  sites having the highest response rate would be least affected by vote disparities.

Have at it!
Annie
The main reason I find this hypothesis implausible is that the discrepancies for the Supreme Court judges were twice as large and followed the same pattern as the Pres. race discrepancies. There’s no reason to think more people ‘held their nose’ for judges than president!
Regarding those two predictions:
- The sites with the greatest discrepancies were machine counts for SE Wichita, Urban Wichita and Cowley. The sites with the highest %Trump voters were Cowley, SW Wichita and Sumner. No correlation there.
- The site with the lowest response rate, Sumner with 25%, also had the lowest discrepancies between the exit poll and the official results for the Pres. race.
In short, we do not see the other data relationships we would expect if the introverts liars and idiots assumption were false. There is no reason to assume these individuals were more likely to vote for one candidate than another resulting in the bias in our data.
