Warning: count(): Parameter must be an array or an object that implements Countable in /home/cnva1u0um55q/domains/showmethevotes.org/html/wp-includes/class-wp-comment-query.php on line 405
According to Verified Voting Lousiana (like South Carolina) votes on electronic machines without a paper trail. These are not verifiable in any meaningful way. They have been banned in other countries (like Ireland) They were used for this primary election LA. However, they do provide for allowing the results to be quickly placed on-line.
After my letter to Bernie, analyzing both R and D primaries for Oklahoma, I had some feedback suggesting I should contact Trump. While I’m not entirely comfortable doing so, please feel free to share this and the OK analysis with Trump supporters and/or pass it on to his campaign.
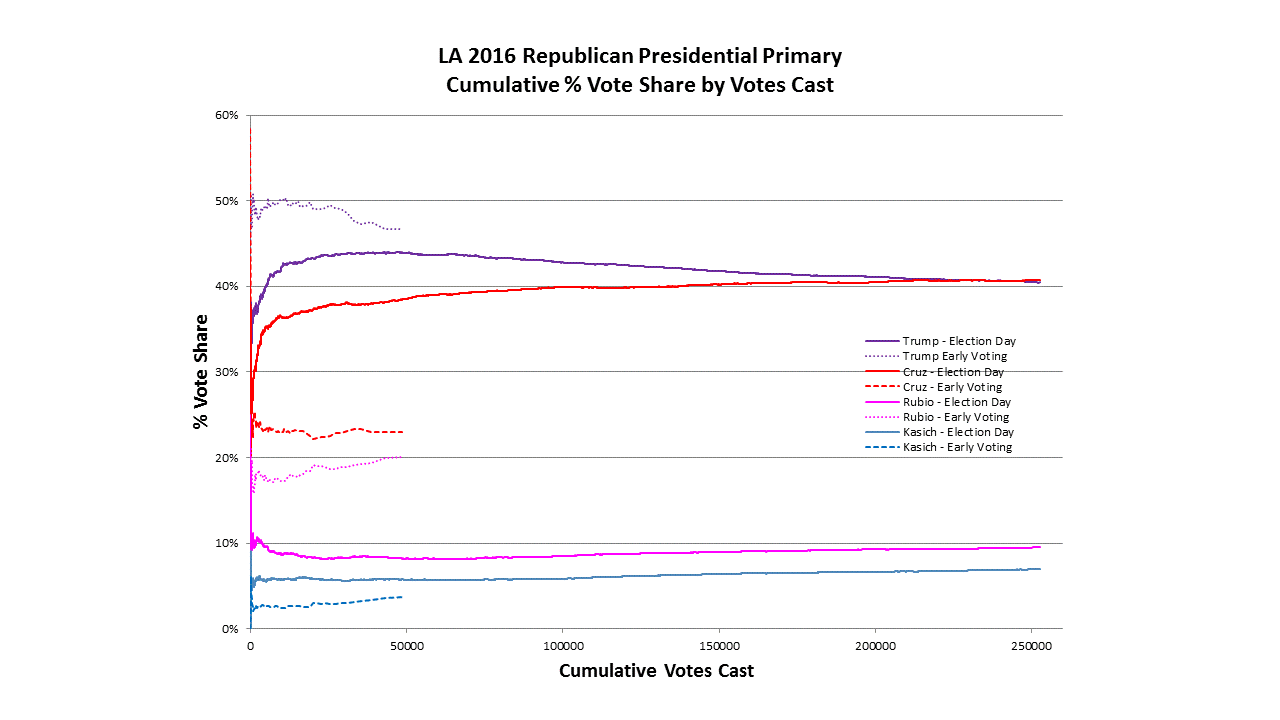
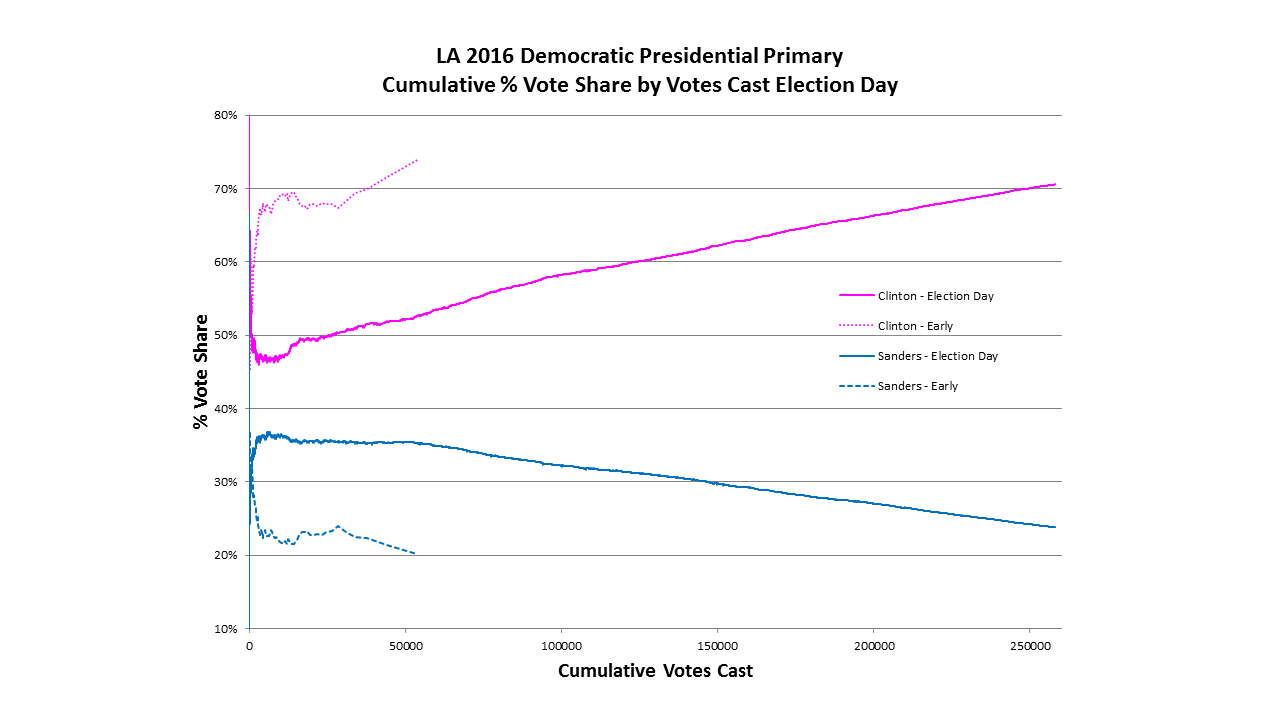
For the LA analysis, I have separated the election day and early voting ballots and graphed them separately against their respective total votes cast per precinct. As before, the graphs show the cumulative share of the vote each candidate acquires as the size of the precincts increase. If there is a visually obvious slant to the line, then it is NOT a random fluke; it shows that a relationship exists between the two variables, percent vote share and number of ballots cast per precinct. This is a consistent pattern with machine counted votes. While in OK and LA, these trends were not enough to change who won the election, they may have had an impact on the number of delegates each received.
There are major differences between the overall level of support for all candidates in the early ballots versus the election day ballots. Please keep in mind that the jumps in % vote share is NOT a sign of manipulation – at least not illegal manipulation. It is more appropriately interpreted as reflecting the impact of the campaigns and other news stories immediately prior to election day. For this analysis, only the slope of the line has significance.
2016 LA Rep. Pres. Primary For the Republicans: In the early voting Cruz, Rubio and Kasich all gain vote share with increasing votes cast, while Trump loses votes. The early votes are significantly different from the election day ballots though, with Rubio and Trump dropping sharply while Cruz and Kasich both go up.
2016 LA Dem. Pres. PrimayFor the Democrats: Other than Hillary being the clear favorite as opposed to Bernie, this chart mirrors the OK primary analysis. Hilary consistently wins a larger share of the votes as the precinct size increases.
The answer to this question is “Yes, it’s possible”. I’ve seen several claims that people can explain the patterns in the data that I find concerning with voter registration of party and/or % turnout by party and/or other demographic variables. I haven’t yet done much analysis into these factors, primarily because I haven’t had access to precinct level data. I’m working on that and may have an acceptable database of those statistics ready soon.
At the county level, for the data I’ve looked at, such factors only explain a portion of the trend. Further, the pattern in the cum sum % analysis is not what would be expected by demographic type factors. We should see a leveling out after a rise due to those factors, not the continuous increase those models frequently show. If you check the Wisconsin graph, broken down by voting machine type, the pattern I would expect to see exhibited for that type of issue is shown by the purple line as opposed to the red lines (increasing) or the green line (paper ballots only).
However, even if all these patterns (which are consistent across different states and elections while showing similarities by voting machine type) are explainable in such a manner. At this point, I consider the fact that our voting machines in Sedgwick County have never been audited or checked for accuracy after an election to be equally concerning. Without such an audit, we do not know whether the votes have been counted accurately. IMO, that’s a serious problem and my lawsuit at least illuminates that issue even if I never get access to the paper audit trail.
I have poked around in the Kansas Senate and Wisconsin Governor election results, which to my eye look the most dramatic, and I see that there does appear to be a Republican bias in the larger precincts. Not much, just a few percentage points, but the effect is real. What I don’t understand is what suggests that this might be sinister, as opposed to being just one of those oddities that crop up from time to time.
And thank you for looking into this. I have family in the Wichita area, and I want their votes to count.
Regards, Bob
Bob, thanks for caring enough to poke around the statistics. I appreciate the concurrence regarding a Republican bias in the larger precincts. You ask good questions.
Why should this small trend disturb us? Why isn’t it just considered a statistical oddity?
It’s not a statistical oddity because it crops up all over the U.S. Therefore, it’s a pattern, not an oddity or ‘one-off’ situation that isn’t expected to be repeated. It cannot be dismissed as an oddity; it is a pattern that has some explanation. Vote rigging is one such explanation, but this analysis cannot establish cause. An audit could establish cause and that is why I am trying to get access to the paper records.
Why consider it ‘sinister’ or evidence of voting machine manipulation? The evidence for this is more complex and not necessarily statistical, such as the documented vulnerability of the machines to being hacked. The most convincing piece of statistical evidence against the various voting machines is that if you separate out the different types, only some types of machines demonstrate this trend. When I separated out the Wisconsin Gov. Election results for paper ballots only, no voting machines involved, the results not only do not show this trend, but form a beautiful example of what is expected under the null hypothesis of no trend.