According to Verified Voting Lousiana (like South Carolina) votes on electronic machines without a paper trail. These are not verifiable in any meaningful way. They have been banned in other countries (like Ireland) They were used for this primary election LA. However, they do provide for allowing the results to be quickly placed on-line.
After my letter to Bernie, analyzing both R and D primaries for Oklahoma, I had some feedback suggesting I should contact Trump. While I’m not entirely comfortable doing so, please feel free to share this and the OK analysis with Trump supporters and/or pass it on to his campaign.
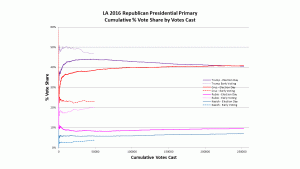
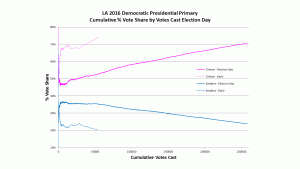
For the LA analysis, I have separated the election day and early voting ballots and graphed them separately against their respective total votes cast per precinct. As before, the graphs show the cumulative share of the vote each candidate acquires as the size of the precincts increase. If there is a visually obvious slant to the line, then it is NOT a random fluke; it shows that a relationship exists between the two variables, percent vote share and number of ballots cast per precinct. This is a consistent pattern with machine counted votes. While in OK and LA, these trends were not enough to change who won the election, they may have had an impact on the number of delegates each received.
There are major differences between the overall level of support for all candidates in the early ballots versus the election day ballots. Please keep in mind that the jumps in % vote share is NOT a sign of manipulation – at least not illegal manipulation. It is more appropriately interpreted as reflecting the impact of the campaigns and other news stories immediately prior to election day. For this analysis, only the slope of the line has significance.

For the Republicans: In the early voting Cruz, Rubio and Kasich all gain vote share with increasing votes cast, while Trump loses votes. The early votes are significantly different from the election day ballots though, with Rubio and Trump dropping sharply while Cruz and Kasich both go up.

Beth, I have been following your work since the very beginning. Thank you so much for what you do.
With that being said I have a request that I’m sure many other people also want; can you PLEASE put graphs showing what a normal election should look like with every one of your posts or at least some? To those that don’t have a background in statistics, your work isn’t as easily understandable. For all we know, all election results look like your examples showing fraud because we have no control.
Thanks, and keep it up!
Wow that was odd. I just wrote an really long comment but
after I clicked submit my comment didn’t appear. Grrrr…
well I’m not writing all that over again. Anyhow, just wanted to say wonderful blog!