What data was excluded from my analysis and why:

ALL of the raw data from all five exit polling locations has been posted. However, I had concerns about some of the data collected and that I will not be including it in my analysis at all.  This is not unusual in any research endeavor.  Prior to analysis the data must be vetted for accuracy and validity.  I exclude data from my analysis when I feel including the data could lead to erroneous conclusions regarding election fraud occurring.

I am not including the scanned paper ballot survey data from the Urban Wichita and Sumner County sites.  eta: The Cowley County Paper Ballot data is also being excluded.  See update at end of post.  The reason is that when I look at the response rate for the different methods of voting, I see signs of potential problems at those two locations.

I am concerned with the relatively low response rate for provisional ballots and relatively high rate for the scanned paper ballots.  I suspect that in those two sites, some provisional voters mistakenly indicated the scanned paper ballot.  This was a relatively easy mistake for voters to make; they might not be tuned into the difference between them.

Since one hypothesis I’ll be testing later is whether or not the provisional voters’ choices were different from the counted ballots, this concern renders the data from those sites as inconclusive. Under this circumstance, voter error is a reasonable alternative explanation to election fraud for any statistically significant differences.  Because my main concern is with the voting machine results, I decided not to include the results for the scanned paper ballots from those two sites in my analysis.  I may revisit this assumption later if the provisional votes are not found to be significantly different from the votes that were counted.

On the other hand, since the leakage appears to shift voters from provisional to scanned paper ballots, the data from provisional voters can be considered representative.  However, only the Urban Wichita provisional data will be analyzed because the Sumner County provisional sample had only 13 surveys; not large enough to draw any conclusions from.

I am keeping the provisional surveys from the SW and SE locations even though had much higher rates of provisional voters, with the SW location claiming 101% response rate, with one more provisional survey than the official count.  Clearly we had at least one confused survey taker.  But since the response rates for the machine and scanned paper ballots are similar in those cases, my assessment is that people who voted provisionally were simply more likely to complete one of surveys.  They were worried their official vote wouldn’t be counted.  One such voters complained bitterly to us about it while filling out our survey. Suddenly, their name had simply vanished from the registration books despite having voted there regularly in the past!  One of our volunteers had the same experience.  This excess of provisional voters does not seem likely due to contamination from the scanned paper ballot  voters, so the data from provisional voters  can be considered representative.

Blanks – They’re a technical issue for surveys.  There are two sorts of blanks with respect to survey responses.  A survey taker might not indicate an answer on one or more questions.  These were coded NR (No response) and were not included in any further analysis.  Valid responses to other questions were retained.  Overvotes on any question were treated the same.

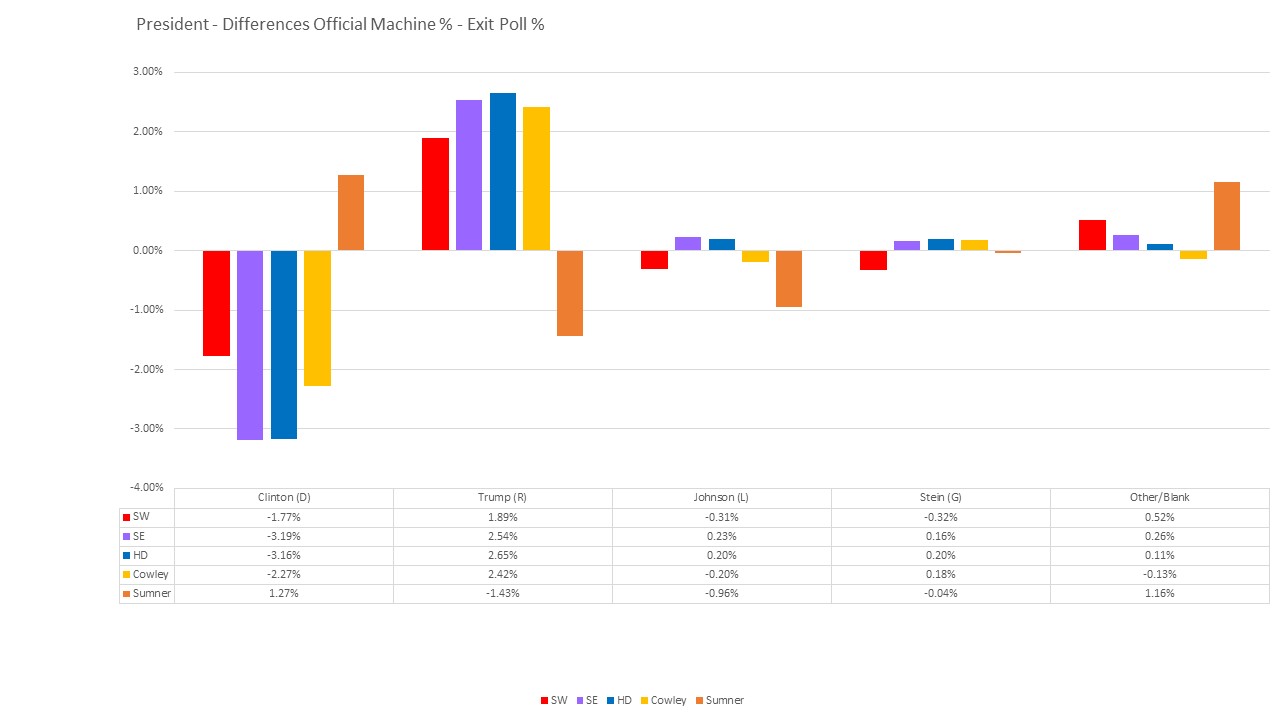
We included ‘Write in or left blank’ as an option to the candidates as much as possible. Space on the survey form was at a premium, and some site managers deciding against including it on all questions.  I insisted on it for the questions asked on all surveys.  I felt it of particular importance for the presidential election given the candidate selection.  For those three questions, people who didn’t answer that question are removed from the sample, but we can compare the rates for write-in or left blank with the number of write-ins and undervotes on the official results.  For other questions, including the judges, undervotes and ‘write-in or left blank’ are taken out of the sample and all subsequent computations unless specifically stated otherwise.

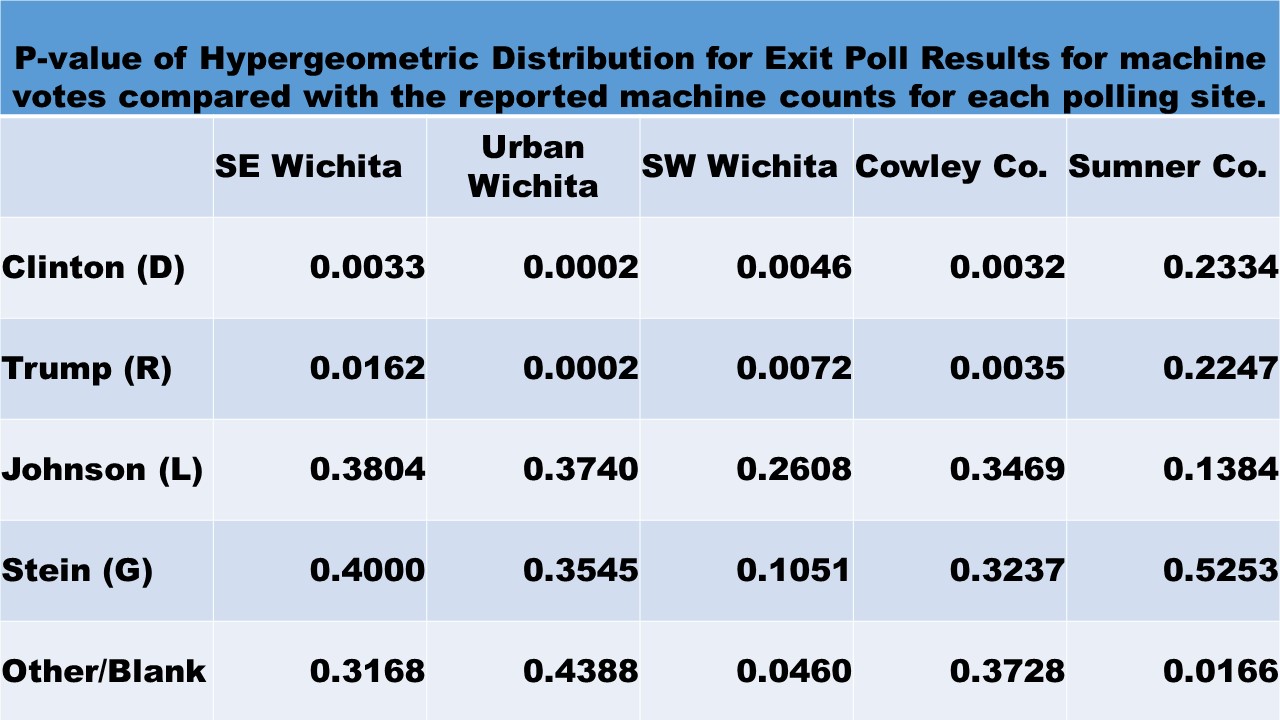
These choices do affect the p-value computations of the hypergeometric distribution given in my tables.

ETA: Cowley County Paper Ballot Data removed from original analysis

On Feb 11th, I spoke with the Women for Kansas Cowley County (W4K-CC) Meeting.  We discussed the results of the exit poll they had run on Nov. 8th.  The Karen Madison, the Cowley County  county clerk/election officer was there and made some details about their data aggregation method I was previously unaware of.  The totals for the Cowley County Mail In Ballots are included with totals for the Paper Ballots cast on election data at the polling location.  I does NOT include provisional ballots, but the inclusion of the mail-in ballots in those totals makes it no longer an apples-to-apples comparison as at the remaining two Wichita sties.

As a  result, I have removed that dataset from my upcoming peer-reviewed publication.   I have decided to leave my original blog post unchanged while updating this post and discussing the implications of removing the data in a future post.  I will post details regarding publication of my paper once they are finalized.  It will be available on-line on an open access journal site prior to publication on paper this summer.

Hypergeometric p-value computation for Exit Poll Results using Excel

This post is a primer on how to test exit poll results with official results using the Hypergeometric distribution function in EXCEL.  You can check my computed p-values for the exit poll results using this formula.

The Hypergeometric distribution is used to determine the probability (p-value) of getting a random sample, drawn without replacement, as extreme or more so given the population that the sample is drawn from.  If that wording sounds unnecessarily complex, I sympathize. Unfortunately, precision is often complicated to articulate.  This definition is hard to parse and you need a working knowledge of what the statistical terms and phrases mean.

“With” versus “without” replacement is an important descriptor of a random sample.  A situation with replacement is akin to selecting a card from a deck, then returning it back to the deck before drawing another card. Without replacement is selecting a second card from the 51 remaining in the deck.

This nuance in the drawing of the sample affects the basic assumptions statisticians build equations from. Different statistical distributions have been developed to handle the two situations.  Because voters were only asked once to fill out our survey, the exit poll sample is ‘without replacement’ and the Hypergeometric distribution is the most appropriate choice for testing the size of the errors.

Another important and relevant statistical concept:  One-sided and Two-sided tests.

Most distributions, including the Hypergeometric distribution, have the majority of data crowded around the average and the data gets sparser the farther away from the average. This type of distribution has ‘tails’.  There are the two directions of tails relative to the average value: upper and lower.

Tails of a distribution

When we perform a statistical test, we are looking at the deviations from what is expected given the underlying distribution of the data.  In some cases, we may only be interested in deviations in a particular direction – high or low.  In those cases, we can increase the precision of our test by only looking at one end of the distribution. This is called a one-tailed test.

In other situations, we are interested in differences in either direction, so we are examining both the upper and lower tails of the distribution.  In our exit polling data, we are looking at the deviations both positive and negative, to determine if either are unusually large.  Therefore, it is a two-sided test.

The EXCEL HYPERGEOM.DIST function computes only the lower tail p-value.  This result can be manipulated to find the upper tail probability. Both need to be computed. This EXCEL function requires five inputs:

  1. Sample Success – This is the total number of exit poll surveys for the candidate in that race at that polling place using that voting mechanism.
  2. Sample size – This is the total number of usable exit poll surveys from voters for that race at that polling place using that voting mechanism.
  3. Population success – This is the total number of voters for the candidate in that race at that polling place using that voting mechanism.
  4. Population size – This is the total number of voters for that race at that polling place using that voting mechanism.
  5. Cumulative – Input 1. This is a technical detail of the statistical test.  A zero will result in the probability of getting exactly the results we input, no more and no less.  Putting a one here gives the lower tail probability, which is what we want.

EXAMPLE:  Hillary Clinton received 435 votes out of 983 cast on the voting machines at the SE site.  That’s a 44.25% vote share.  Our exit poll data showed Hillary Clinton received 306 votes out of 645 survey responses to this question from voters who cast their votes on those same machines at that polling location.  That’s a 47.44% vote share.  The difference between those two values, -3.19%, is the error. This error measurement is computed for each candidate, race, type of voting equipment and polling location.

Use EXCEL function HYPERGEOM.DIST with the following inputs:

  • Sample_s = 306
  • Number_Sample = 645
  • Population_s = 435
  • Number_pop = 983
  • Cumulative = 1

Lower Tail P-value for Clinton, Machine Votes, SE Wichita

= HYPERGEOM.DIST(306,645,435,983,1) = 0.9979

Whoa!!  I thought you said Hillary got cheated?  This result is a near certainty.

That’s because our exit poll sample had a larger percentage of Hillary voters than the official results did.  Her exit poll results lie in the upper tail of the distribution, well above the official average.  We just computed the p-value for the lower tail i.e. the probability of randomly getting as many Hillary votes as we did (306) or LESS.

Next we need to compute the probability of randomly getting as many exit poll votes as she did or MORE.  The upper tail of the distribution.  Through the magic of math, we can find the upper tail probability with a modification to this function.

Subtract 1 from our sample size and compute the lower tail probability for that sample size.  Then subtract that lower tail probability from 1 to get the correct upper tail p-value.

Upper Tail p-value for Clinton, Machine Votes, SE Wichita

= 1.0 – HYPERGEOM.DIST(305,645,435,983,1) = .00325

Finally, because we did not specify in advance what direction we expected to see, this is a two-tailed test.  For two-tailed tests of this nature, the p-value is computed as double the minimum one-tailed p-value, capped at 1.0.

Two-tailed p-value for Clinton, Machine Votes, SE Wichita = 2*0.00325 = 0.0065.

Finally, putting it all together in one cell, nesting the needed functions:

Two-tailed p-value for Clinton, Machine Votes, SE Wichita

   =2*MIN(+HYPGEOM.DIST(306,645,435,983,1), 1-HYPGEOM.DIST(305,645,435,983,1), 0.5)


Picture from http://www.ats.ucla.edu/stat/mult_pkg/faq/pvalue1.gif

Exit Poll Data

This post contains links to the citizens’ exit poll survey forms and results.  I will post the analysis of those results separately.

There were five sites sponsored by the Show Me The Votes Foundation. Each site was independently run by voters from that area.  I provided guidance and instructions as well as training for volunteers.  You can learn more about how these exit polls were set up and run here How to run an exit poll.  Polls were manned the entire time the polling station was open. Voters were asked personally to participate; responses were kept anonymous.

The site managers were all amazing.  We got excellent response rates.  This study and these results would not have been possible without their help and the help of the dozens of other volunteers who were willing to take a few hours out of the day on Nov 8th to man my exit polls.  Thank you all.

I ran the Southeast Wichita site.  The questionnaire I used is the basic form that the others were built off of.  All questions on that form were common to all five sites.  There were no questions on races specific to my polling location.

Wichita Exit Poll Survey Form

Southeast Wichita Exit Poll Results

The Sumner County site was run by Glen Burdue in Wellington KS.  He modified his survey to add some additional questions specific to his polling location.  We had relatively few volunteers in the Wellington location, but he made up for it with dedication to the project.  Glen spent considerable time notifying and clarifying his exit poll with the county officials not to mention collecting surveys all day long on Nov 8th. Then he counted all the surveys himself, no small task by itself.

Sumner County Exit Poll Survey Form

Sumner County Exit Poll Results

The Cowley County site was run by Pam Moreno of Winfield KS.  She is an amazing organizer and and is a leader in the Women for Kansas – Cowley County chapter.  We ran a volunteer training session one October evening.  Her group also added a few questions to our basic survey that were specific to Winfield.  She also got volunteers to help do the counting the next day and professional help with the data input into my spreadsheet for analysis.

Cowley County Exit Poll Survey Form

Cowley County Exit Poll Results

The  Urban Wichita site was run by Lori Lawrence at the Health Department on 9th Street.  She did a phenomenal job, doing everything from baking cookies to attract voters to respond to getting buttons printed up for our volunteers to wear.  In our planning meetings, she made many excellent suggestions for ways to improve our exits polls.  She ran the same basic questionnaire that I did at the Southeast Wichita site.  She also did the complete first count on all her surveys.  With 883 useable surveys, that was a huge chore!

Urban Wichita Exit Poll Results 

The Southwest Wichita site had two co-managers, Lisa Stoller and Leah Dannah-Garcia, two excellent ladies who were devoted to accomplishing this.  They collected 1,435 usable surveys, a response rate to eligible voters of 80%.  Fantastic.  Counting all those surveys was a daunting task.  I dare say that aspect of it was as difficult for those extroverts, who were so excellent at running the exit poll, as the task of walking up to strangers and asking them to fill out a survey form was for introverts like me.  They needed help.  I ended up parceling them out to other volunteers as it was an overwhelming task, even for a veteran survey counter like myself.

SW Wichita Exit Poll Survey Form

SW Wichita Exit Poll Results

Exit Poll Results – Machine Vote Counts were Altered in S.E. Kansas

The Show Me The Votes Foundation sponsored five citizens’ exit polls in S.E. Kansas to assess the accuracy of machine vote counts.  The results of these citizens exit polls provide tangible evidence of election fraud in the presidential race.  I designed the exit polls explicitly so they would provide evidence of election fraud should any be present. The only better evidence would be an audit showing the discrepancies in the actual ballots.  But audits of the voting machine results are not allowed in these Kansas counties.

Exit polls – taken as people are leaving the polling place – are extremely accurate at capturing the vote share of candidates. Staffed by volunteers from the polls open to their close, we achieved outstanding response rates. These are shown in the table below.


eta: after final counting, the SW Wichita votes for Trump changed from 609 to  611.  

Polling Station and Exit Poll Results

Polling Station and Exit Poll Results

A rule of thumb is that 2% or larger difference in vote share between the official results and the exit poll is evidence of election fraud worth investigating.  We had such excellent response rates at some of our sites that differences significantly smaller than 2% are considered suspect in some races.

In addition, we can take into account the overall composition of differences between the official results and the exit poll statistics for each site.  For example, at the Wellington polling site in Sumner County, all Republican candidates had lower vote share in the machine counts than in the exit polling results.  This consistency is suspicious even though the differences may be small.

The exit poll results indicate that our machine generated counts are being manipulated. Polling sites in Sedgwick and Cowley counties were manipulated for the benefit of some candidates, most notably Trump at all four of those sites.  Results in Sumner County appear to be manipulated to the detriment of Republican candidates – but not necessarily to the benefit of Democrat Candidates.  Libertarians performed better in the machine counts for both the Senate and the 4th District races than exit polls indicated for all five sites.  These differences are not sizable enough to alter the outcome of most races, but they are consistent and larger than expected by chance alone.  I’ll post more about those results as I do a more detailed analysis for each polling location.

Presidential Race Analysis:

Votes for Hillary Clinton were shifted to Donald Trump in four of the five polling locations we surveyed, Sumner being the exception.  This chart shows approximately 2% to 3% of the machine votes were shifted from Clinton to Trump at those sites, adding 4% to 6% of the vote share to the difference between them to benefit Trump.   The other candidates show only normal error rates.


Machine Votes and Exit Poll Vote Share Differences

Figure 1 –  This graph shows the difference between the machine vote share and the exit poll vote share  for each candidate at each site.  Positive values show that the machine count benefited that candidate.  Negative numbers indicate a loss compared with the Exit Poll results.

Sites in Sedgwick and Cowley Counties show a distinct bias with the machine counts siphoning votes from Clinton and benefiting Trump.  Sumner County exit poll results for the Clinton and Trump were not statistically significantly different from the machine counts for Sumner County.

Since Trump won Kansas with 54% of the vote to Hillary’s 36%, even assuming this shift held across Kansas (it didn’t), it was well below Trump’s margin of victory, so this manipulation of votes did not alter the outcome. Still, it is disturbing evidence that the machine vote counts are being altered. In other states, which use similar equipment, manipulation at this level could have changed who won the Presidency.

Statistical Details

I computed the exact probability of each candidate getting the vote share they received in our exit poll given the official counts for that polling location.  This was computed using the Hypergeometric probability distribution, which takes into account both the size of our exit poll sample and the number of people who cast votes at that polling location on Election Day.

This probability – or p-value – is the exact computation of the probability of getting our exit poll results assuming no election fraud occurred.  The p-values for the different presidential candidates at each of the five exit poll sites are given in the table  below.

P-values for Exit Poll results of Machine Votes in Presidential race

The p-value represents the level of concern about the official results given our exit poll results with 1.0 indicating everything’s normal, nothing of interest here and zero indicating Red Alert  Danger Will Robinson! Danger! The computed p-values always fall somewhere in-between.

The probabilities for Johnson and Stein  are all quite reasonable and raise no serious alarms regarding the accuracy of their vote counts.  The probabilities for Clinton and Trump, on the other hand, are low enough to sound alarms for four of the five polling locations.

These exit poll results more than justify a call to audit the voting records and a profound skepticism in the results of machine counted votes.

The Cumulative Vote Share (CVS) Model is Validated as a Sign of Election Fraud

The math underlying this model dictates that this trend should level off horizontally, not start moving in the opposite direction.  It means the trend is not random chance, but due to a specific cause correlated with precinct size. It is such unanticipated trends as revealed by this type of graph that motivated me to look more closely into our vote-counting process, eventually leading to conducting the exit polls in this past election.

cvs-pres-sedgwick-countyThis is CVS graph for Sedgwick County. It shows Trump getting an increase of ~2% of the total vote share and Clinton losing that same amount from their respective inflection points at around 93,000 cumulative votes.  These exit poll results vindicate the use of the cumulative vote share model in assessing probability of election fraud.


Exit Polling Report

We ran a total of five exit polls Tuesday, three in Wichita.  We were outside, so we were hoping for fair weather.  Although the morning started out damp and dreary, it was nice most of the day, albeit a bit chilly after dark.  Setting up to be operating at 6:00 and running until the close of polls made for an exhausting day although I managed a nap in the early afternoon.  Everything went fairly smoothly at all locations.  In SE Wichita, we gave away 10 dozen donuts before 9:00 am with candy after that to bribe voters to talk with us.  I had to make a run for more candy at 4:00, but no major impediments or problems at the S.E. location.

The most interesting thing that happened was regarding a young black woman who had declined to participate in our exit poll.  Later that evening, near to the polls closing, she was back.  Apparently her mama had voted there early that day and filled out our survey.  She had insisted her daughter return to do so. I was delighted!  That young woman has a mama who cares about her and about making her voice heard by voting.  I wanted to thank her and tell her she’s an awesome mom!  But I was too busy handing out survey forms to other voters.  We had excellent participation rates!

I took both Tuesday and Wednesday off work, and was able to spend all day counting ballots Wednesday.  I’m also an experienced survey counter, so I managed to get the 925 surveys organized and counted by the end of the day.

My volunteers are working together to get the other sites counted, but they have other things to do too.  Altogether, we have collected thousands of exit poll surveys.  Counts are continuing even as I write this.  That I want the surveys from each site to have two independent counts doesn’t make the task any easier.

I also need to verify the results we wrote down at the polling stations, but was informed today that they won’t be available until after the canvassing is complete, approximately a week to ten days from now.  I’m glad I asked my site managers to get the totals that night from their polling stations.  I can go ahead and work on my analysis, updating it with any corrections needed when the data is available.  But I’ll hold off publishing the results until I can verify the numbers.

I will share some general stuff from my initial numbers for my site with the caveat that these results are considered preliminary until the data has been verified.

The scanned paper ballot official counts and our exit poll results are close, with nothing falling outside reasonable statistical bounds on any of the races.

The voting machine counts and our exit poll results are not as close, with a couple of results that bear looking into, but I had three results flagged earlier.  One has already turned out to be a data input error on my part.  (That’s why I want to verify the numbers before publishing).

I will present the exit poll provisional ballot results though.  I’m reasonably confident there are no large errors in my counts and small changes won’t alter these results.

In general, people who had voted provisionally were more likely to have time to take our survey.  We had 79 out of 92 provisional voters fill out our survey for a response rate of over 85%, nearly 20% higher than the 66% response rate of voters whose ballots were counted that day.

rep-share-of-provision-versus-counted-exit-poll-ballots-countrysideIn our exit poll survey, I found that provisional voters were approximately 10% less likely to vote for republican candidates.  I think it is reasonable to take this along with the additional data from the other exit poll locations, as a measure of the effectiveness of Kris Kobach’s efforts to disenfranchise non-republican voters.  I have already contacted the league of women voters to see if this data will be of help with their lawsuit regarding his practices.