Analyzing Exit Poll Results

It’s important to state up front what data will be collected, what analysis to perform on that data and what constitutes evidence of a serious problem versus random errors in any poll of this nature.

Polling stations allow voters access to the results after the polls are closed when the votes have been tallied.  In Sedgwick County, they will have separate reports printed for the electronic voting machines and the scanned paper ballots.

We will also get a count of the number of provisional ballots collected from the polling location.  Theseballots will not be opened until the voter’s registration is verified and there will never be an official tally of the provision votes for polling location.  But we can look at the results we have for voters who submitted provisional ballots and compare them with the votes that were counted at the polling location.  If there are significant differences, this is evidence of the voter suppression effect of Kris Kobachs voter registration rules.

I have created a general data collection and analysis EXCEL spreadsheet.  Multiple precincts vote at each polling location and the results are reported for each precinct, not the polling location, so I’ve set up a spreadsheet to sum the numbers up and compute the appropriate probabilities.

I will be customizing this EXCEL file for each exit poll location in Kansas, but I am happy to share a general version of this worksheet with anyone who is interested in running an exit poll for their own area.  All you will have to do is input the official results and your exit poll results.    This is an example of of the output.


Example Data Analysis
Presidential race Chi-Squared Result:  NA
Candidates Exit Poll Official Results Binomial Probability
Clinton (D) 52 60 0.0638
Trump (R) 38 30 0.0530
Johnson (L) 6 6 0.5593
Stein (G) 2 2 0.5967
Other 2 2 0.5967
Total 100 100

There are two different analyses than can be used in this situation.  The chi-square test will give an exact probability that the actual results differed from what would be expected under the assumption of random chance.  EXCEL has this test as a built in function: CHISQ.TEST.  But the chi-squared test has minimum data requirements which were not met in this example, hence “NA” or Not Applicable as the result of this test.

Since the chi-squared test will not work for every set of possible data, I also show the individual binomial probabilities for each of the candidate.  The minimum probability from this set of five computations is a reasonable approximation to the exact computation using the extension of the binomial distribution and can be easily computed using built-in Excel formula BINOM.DIST.

How to interpret this:

We judge the probability of machine manipulation of the vote by evaluating the probability of our results assuming no manipulation of votes is occurring.  This is referred to as the “null hypothesis”.  All probabilities shown are made under this assumption.  If this probability is above 0.05 (5%), we can reasonably conclude that the differences between the machine vote share and the exit poll vote share are typical of random variation due to the normal errors in the process.

If this value lies between 0.05 and 0.001, raise an eyebrow and give the numbers for that race a little extra scrutiny and consider it in concert with the other exit polling results.

If this values lies below 0.001, that is evidence of fraud.  Personally, I would like to see a recount of any race with results that fall this far from normal.  But only a candidate can request a recount in Kansas.

In this example, I have contrived to show Trump with a questionably low # of votes in the official count compared to the exit poll results.  Hillary has a slightly elevated value.  But these results are not unexpected as the minimum probability of results this far off is above 0.05.

But if the other sites have similar values and they are all benefitting the same candidate, it would be concerning.  If 2 or 3 sites out of 5 show the same beneficiary of the differences, that’s reasonable.  But if 5 out of 5 sites show the same beneficiary, it’s evidence of rigging.

If we see multiple races with low odds and the same slate of candidates are benefiting, we have solid evidence of machine manipulation of our official votes.  If we see only the normal expected errors, then we have solid evidence it is NOT being manipulated.

While a single location and a single race might show evidence of manipulation, savvy cheaters will try to avoid this method of detection by establishing a maximum shift that falls beneath the 0.05 probability results.  But looking at multiple races and sites, we can establish whether even small shifts show evidence of cheating.

We can define a slate of candidates by party and check the probability of getting the results we got using a similar binomial analysis.  Under the null hypothesis of no manipulation, the probability of an error that benefits a candidate is 50%.   There are three races with candidates and five judges we are asking about, for a total of 8 results for each polling location.  Governor Brownback would like to see 4 of the 5 judges lose their jobs and replace them.  We can also presume he supports the Republican Party candidates for President, Senate and Representative.

We will have data from 5 different locations for a total of 40 random samples with approximately 50% probability.  (For example, let X be the number of errors that were the opposite of the Brownback administration preferred candidates. If we have 40 random samples as defined above, the probability of getting errors in the opposite direction of his preferred result is computed with the following excel formula:  BINOMDIST(X, 40, .5, 1)

If this value is extremely low (less than .001), we conclude that the Republican Party has unduly benefited and further investigation would be appropriate.

How to interpret the Provisional Ballot Data:

We cannot know the final count of the provisional ballots collected at a polling location.  They are polled at the county level and only those that are shown to be registered voters are opened and counted.   What we can do is compare the results of the provisional ballots with the other responses to our exit poll.   If there is a major difference between those asked to fill out provisional ballots with the automatically counted votes, we have a measure of the effect of the voter ID laws and if it made a difference to the outcome.

For each race, we can use the chi-square test if we have sufficient data.   Otherwise, we can use the binomial approximation similar to the one used to compare the official count to the exit poll survey results.

electioneering and instructs them regarding what they can and cannot do.  While permission is not required to run an exit poll, we do need permission from the property owner to set up a booth to collect our ballots and provide chairs and shade for our volunteers.  Mainly, we want everyone to know what we are doing to avoid any issues arising on on election day.

How to Run an Exit Poll Part 1
How to Run an Exit Poll Part 2

Creating an Exit Poll Ballot

Creating an Exit Poll Ballot

This is part 3 of my “How-to-Run-an-Exit-Poll-Series.

The exit poll survey ballot is important, but not complicated. The only question of interest, other than their ballot choices, is the method of voting.   Data will be available at the end of the day with separate totals for the machine cast votes and the scanned paper votes.  There will be no official count of provisional votes at this station, so we can only compare those votes to overall total for the polling station. But that comparison allows us to evaluate whether the giving people provisional votes amounts to a voter suppression tactic.

Since space on our survey form is at a premium, and because including that information makes their response less anonymous, I do not recommend including questions about age, race or gender.  Generally speaking, you want to keep the words to minimum.  (Not an easy task for me.)

Here is an example survey I have developed for exit polls in Sedgwick Co.  I included a short paragraph at the top because I feel it’s important to let people know why you want this information and reassure them that results are anonymous, just like their vote.

Sample Exit Poll Survey

The first question is really too long, but I wanted to be as clear as I can about this question.  In Sedgwick County Kansas there are three possible options:  A vote cast via electronic voting machine, a paper ballot that the voter feeds into a scanner for on-site electronic counting or a provisional ballot – a paper ballot that is sealed into an envelop to be counted later (maybe).

Asking about the specific races is straightforward.  State the office and then list the candidates.  Circling answers reduces the need for a blank or box to check.  It saves space on the page.

Staggering the answers for questions with more than one line of answers (ex: Pres) makes it easier to discern the voters intent.  When they are stacked one above another, the answer may easily become ambiguous.

Since a single polling location will have multiple precincts voting there, it’s a problem asking about races where different precincts will be voting  for different candidates.   Generally, I want to confine the questions to races that will appear on every ballot at the polling location.   On the other hand, my site managers for the SW Wichita location are very interested in the county commissioner races.  We arrived at the following:

Who did you vote for your County Commissioner Race? (Select one for District 2 OR  District 3)   –  sw-wichita-nov-8-exit-poll-ballot

I have hopes that we won’t get too many voters identifying their choices for both district 2 and district 3, but I expect we will get some.   OTOH, it’s the only question that would be spoiled and I’m reasonably comfortable in assuming that such mishaps are equally likely to occur regardless of which candidate they support.  I think we will get good data from this exit poll.

How to Run an Exit Poll Part 1

How to Run an Exit Poll Part 2


A Replication of My Work.

Mr. Brian Amos, Ph.D. candidate at the University of Florida was dedicated enough to replicate some of my work and acknowledge that he gets the same results I reported.

He does have a few disagreements with my approach. For example, what he describes as a nitpick, I would respond with: That’s a feature, not a bug! My choice of limiting an analysis to the precincts with more than 500 votes cast results in what he considers an overemphasis on the effect I’m am concerned with. This is absolutely true. That particular analysis was designed to draw out that effect and make it more apparent. The vote share data is very noisy and impacted by many different factors. The trend is real, but is easily missed in the inherent noise of the larger dataset.

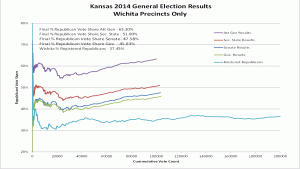
Wichita 2014 Election Results

Mr. Ames wonders if some other, correlated factor such as the voter registration numbers, would display a similar trend in the cumulative chart. He shows this is true for the share of Republicans in this particular data set. But this is not a universally correlated trait across the different states where such trends have been found, and it was not enough in Sedgwick County Kansas to account for the difference in vote share.

I discuss this factor at more length in my recently published paper “Audits of Paper Records to Verify Electronic Voting Machine Tabulated Results” in the Summer 2016 issue of The Kansas Journal of Law and Public Policy. The graph displayed above is from that paper, illustrating that although there is an upswing the cumulative graph for share of Republicans, it is much smaller than the upward surge of the vote share for various republican candidates in 2014.

His parting comment “While the charts may be explainable through vote fraud, there are other, perfectly innocuous explanations that can be put forward, as well.” is true. Yes, there are other possible and innocuous explanations. Statistical analysis only illuminates correlations and other relationships. Further investigation is needed to determine cause. Just because the trend is a predicted sign of election fraud does not mean election fraud occurred.

The only way to tell if our machine tabulated vote count is accurate or undermined is to conduct a proper audit. That’s never been done here in Sedgwick County. I’ve requested access to do this as a voter and been denied. I filed the proper paperwork in a timely manner asking for a recount of those records after the 2014 election and was denied. I’ve sued for access as an academic researcher and been denied.

Why should I trust a vote count that our officials will not allow to be publicly verified? Why should anyone?

Another Analysis of 2016 Democratic Primary

This is a solid analysis. I say this without having vetted their data collection, I’m assuming they did that part right. If so, the conclusion is obvious. They authors confine all analysis to the appendix, so you can read the paper without having to understand any math.

Are we witnessing a dishonest election?

They found Sanders won 51% to 49% in places that had a paper trail. They found Clinton wins 65% to 35% in places that don’t. That’s amazing! Yes, those are different states. Yes, they looked at a different possible causes They tested for that difference while accounting for the % whites and the ‘blueness’ of the state. No, they didn’t find anything sufficient to explain that difference.

You don’t have to be a statistician to understand that’s a huge difference in proportion. It helps to be a statistician to understand the tests they ran checking other explanations and the resulting output. They are running appropriate tests and the output is unequivocal. Which they stated. I concur.

“As such, as a whole, these data suggest that election fraud is occurring in the 2016 Democratic Party Presidential Primary election. This fraud has overwhelmingly benefited Secretary Clinton at the expense of Senator Sanders.”

Redacted tonight makes this article their lead story.

BTW, I absolutely loved their fake commercial for “Shut your f***ing tweethole” at the 15 min mark.

Authors response to criticisms

My work, some of my graphs and my previous post, are included in the appendix of the response article. Lots of interesting graphs there too.

An Open Letter to Bernie Sanders

Dear Bernie,

If you want to win the presidency and elect a revolutionary congress, you must find a way to force accurate counts of votes across the country. There is no reason to believe that machine generated vote counts are accurate when they are not checked for accuracy. This is particularly difficult in places like South Carolina and parts of Kansas, where no paper trail exists to even attempt a public recount. Or Arizona where manual hand counting of ballots is not permitted.

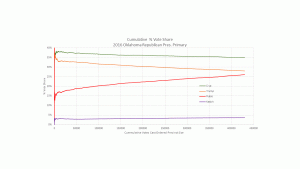
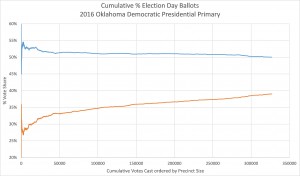
I live in Kansas. I’m a professional statistician and an ASQ Certified Quality Engineer. I find certain patterns in election results quite disturbing. Graphs of Oklahoma primary results are below. Both exhibit a common and concerning pattern: as the number of votes cast in a precinct increases, so does the vote share for the candidate favored by the Washington establishment. This pattern is NOT due to random chance nor do voter demographics explain it. In the fall, the Republican candidates across the board can be expected to show such a pattern wherever machine counting of votes is combined with poor to non-existent auditing of those results. The pattern is consistent with election rigging.

Citizens like myself have had little success in forcing our officials to show the paper trails so we can have confidence in their reported results. I’ve been trying for more than three years to get access to the paper records that would allow me to assess how accurate our computer tabulated official vote counts are. After my latest legal setback, it will be another year before I might get permission. In the meantime, we will be having another election on non-transparent voting machines.

You, as a candidate, have the right to demand manual recounts. Well, in some places anyway. If you were to do so, irrefutable evidence of problems with vote counts will emerge in some of those places. If and only if your supporters can find and correct those problems can your revolution win at the ballot box.

In states that have paper trails, I suggest you start asking for manual recounts of the paper ballots and Voter Verified Paper Audit Trails (VVPAT) where you can. Whether you won or lost the contest doesn’t matter. The point is to evaluate the size and number of discrepancies and check for bias. Laws vary from state to state. Typically there is a short window of time to request recounts. Many jurisdictions will balk and try to keep you from doing so by various legal maneuvers. But there will be many opportunities through the primary season. You have supporters that can be trained and provide labor hours when needed. A 100% manual recount isn’t necessary. A random sample of precincts is sufficient.

If you recount and find discrepancies, you might receive additional delegates. More importantly, if you were to demand recounts, it would highlight the fact that in many states, those machine counts are never audited or verified with the original paper records. Most citizens are shocked to discover that their vote counting process is not verified, or in some places, verifiable. I know I was when I first discovered this truth about Sedgwick County Kansas in 2012.

Thank you

Beth Clarkson


The Charts below show the cumulative share of the vote each candidate acquires as the size of the precincts increase. This model clearly shows that as the size of the precinct increases Clinton and Rubio gain a larger share of the votes while Sanders, Trump and Cruz lose votes. This is NOT a random fluke, this is a consistent pattern with machine counted votes. While in OK, this trend was not enough to change who won the election, it may have had an impact on the number of delegates each received.

2016 Oklahoma Republican Presidential  Primary
2016 Oklahoma Republican Presidential Primary

2016 Oklahoma Democratic Presidential Primary
2016 Oklahoma Democratic Primary

eta: Link to data at OK.gov
eta2: I’ve updated the charts with labels for the Dem candidates and added Kasich to the Rep chart.