With help from nearly a dozen volunteers, I conducted an exit poll on one polling location during this primary. It even made the local newspaper. I am quite pleased with the results; everything went smoothly.
It was primarily meant to be trial run for the Nov. election, making sure that I will be able to collect the data necessary then to identify problems with our machine counts. While some mistakes were made (all by me – the volunteers were fantastic!), I feel confident that we will be able to accomplish that task in Nov.
I know that many people are interested in the results of this survey. Overall, things looked good. There were a couple of yellow flags, but nothing I would recommend taking action on.
Data Collected: The primary question I asked was how the individual had voted, by machine, with a scanned paper ballot, or with a paper provisional ballot: Aug 2 Exit Poll Ballot
The exit poll was conducted at one polling location with survey responses being compared to the machine tabulated results at the polling location. Respondents were asked how they voted, by machine, or a scanned paper ballot or a provisional paper ballot. Results are shown below. Due to the small number of paper ballots, both scanned and provisional, analysis results are shown for the machine tallies and for the totals for the polling location, but not for the paper ballots separately. The count of votes counted and survey collected is shown below in table 1.
Table 1:
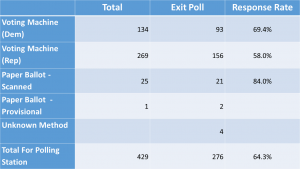
There is a discrepancy between the official count for provision ballots (1) and the exit poll count (3). This is likely due to errors in marking the exit poll, so I am not concerned about this discrepancy.
There were an additional 47 surveys collected that were unusable due to problems that ranged from being completely blank to responses filled in for all races, both Dem and Rep
We asked about six races with two candidates, three races in each party. However, only three of those races were applicable to everyone who voted at that location. There were multiple (5) precincts voting at the polling location. Three of the races asked about were limited to voters in only one or two of those precincts. As a result, survey takers could indicate a choice in those three races even if they did not actually vote on them. For that reason, I have labeled the data collected on those three races as ‘questionable’. Caution should be used in drawing conclusions from the exit poll data for those races.
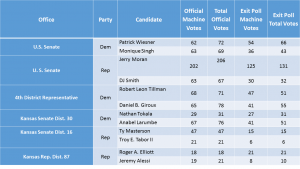
The results for the six races are as follows with the winners names bolded in table 2.
Table 2:
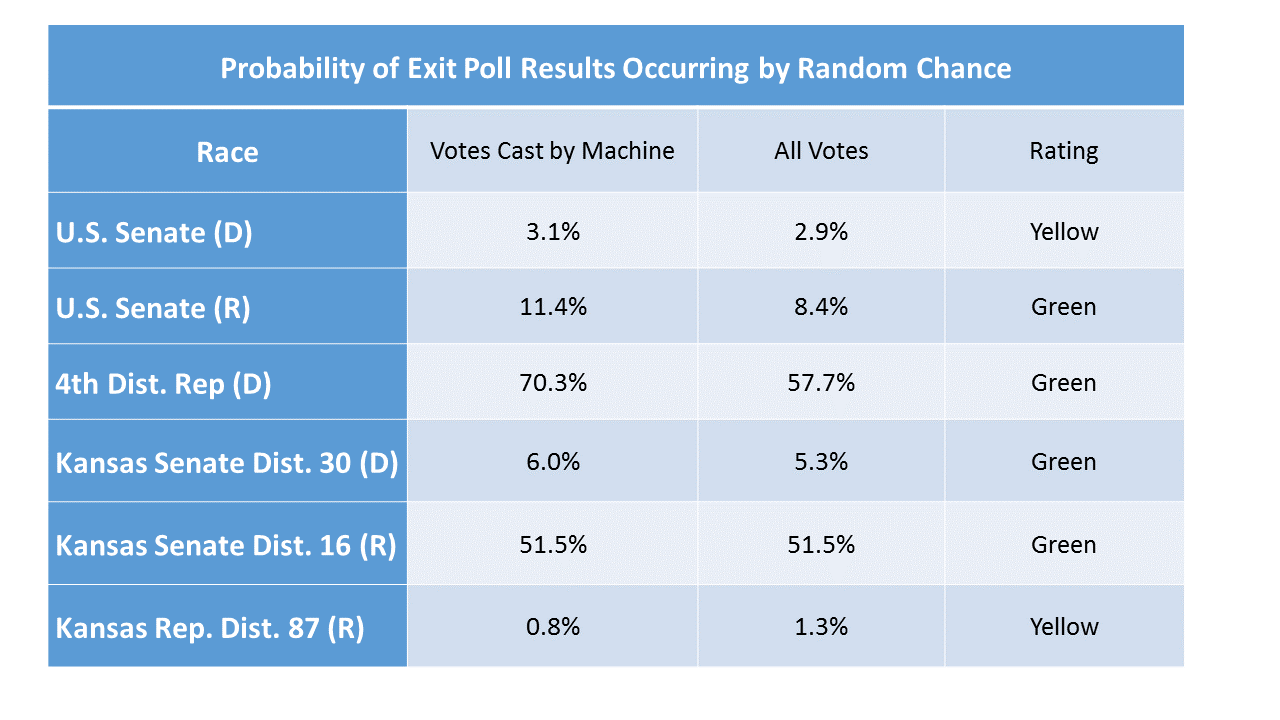
Assuming that the official results were accurate, I computed the probability of our exit poll results using the binomial distribution. I rated those results as being Green (looks good), Yellow (suspicious but not conclusive) or Red (definitely something wrong). The usual threshold for statistical significance is below 5%. There were no red flags, but two of the six races got a yellow caution rating. These results are shown in Table 3.
Table 3:
Races that all survey respondents voted on were the U.S. Senate (Dem and Rep) and the U.S. Rep (Dem). Results for the losing candidates are shown in Figure 1.
Figure 1:
The Senate Race for Dem candidates is given a yellow warning because the probability of the differences between the official results and our exit poll is only 3%. This is not considered a red flag because we are making 12 different comparisons, which needs to be included in assessing the results. For example, if 12 comparisons are made using a 5% threshold, there is a 45.96% probability of at least one of them falling below that threshold by random chance. There’s a whole set of statistical techniques designed to account for multiple comparisons if I wanted to get really precise about it. In addition, while the official votes skewed towards Ms. Singh, she lost the statewide election so even if there was manipulation, it would not have affected the outcome of the race.
We had no method to identify what precinct people were in, so for the Kansas House and Senate races, survey takers could vote for someone who was not on their precinct’s ballot. For this reason, the exit poll data must be considered questionable. On the Republican side, since no precinct voted on both the house and senate races, the 38 surveys with both those races marked were not included in the totals for those two races. Results for the losing candidates of these races are shown in Figure 2.
Figure 2:
The official results for Kansas Rep. Dist. 87 race get a yellow rating. The results were skewed towards Mr. Alessi with only around a 1% chance of occurring by random chance. This is not rated as red because the exit poll data was questionable. However, since Mr. Alessi lost the election, even if there was manipulation, it would not have affected the outcome of the race.
I think that you’re making conclusions that seem reasonable but are overlooking the possibility that the races being skewed aren’t part of the macromanipilation that can be conducted at a state level.
The votes being “skewed” and the improper “flow of votes” could be stolen “votes” from different “ballots” (which each contain multiple contests/votes).
Part of what I have been doing is using the vote cast records in some of our elections and doing machine by machine overall analysis and have discovered candidates getting votes from ballot styles they aren’t even on!
If you manipulate the EL155 (vote image file) and change the candidate name and contest (but leave the rest) then the votes/ballots that are tallied add up. This is particularly true when they use a large number of undervotss to smooth it.
I can e-mail you some of what I am working on so you can see the data in a spreadsheet.