Hypergeometric p-value computation for Exit Poll Results using Excel

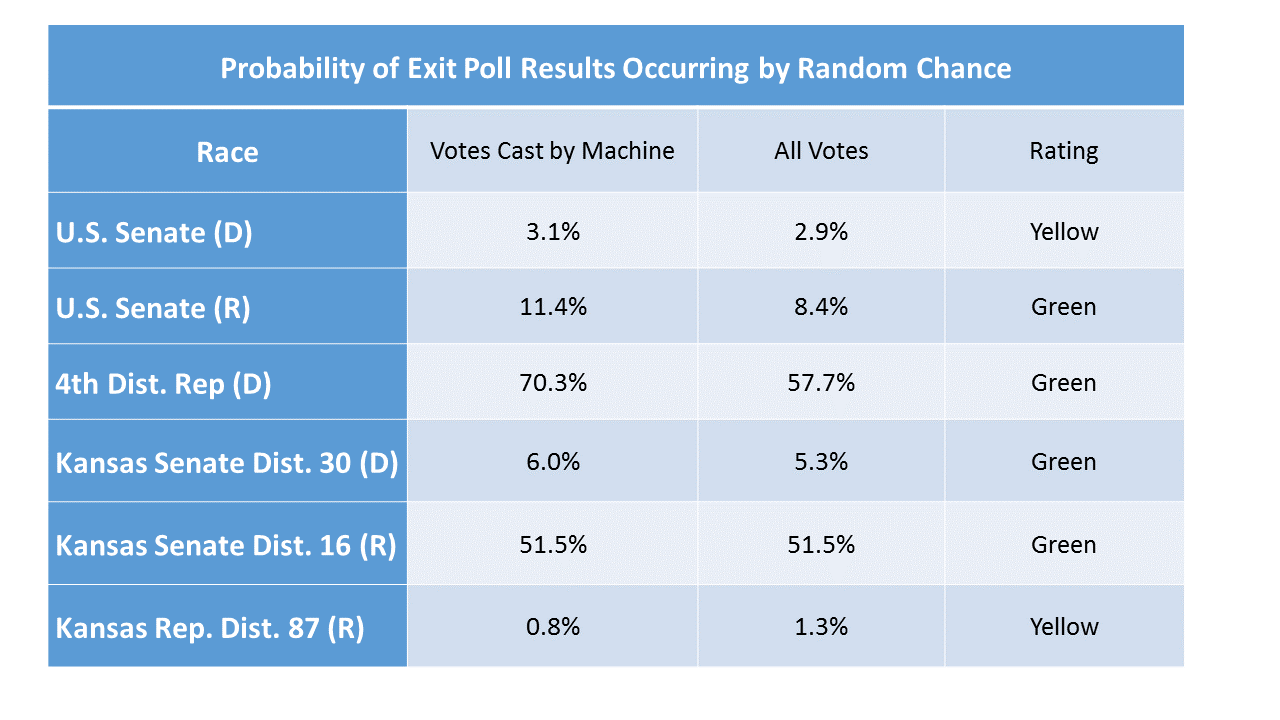
This post is a primer on how to test exit poll results with official results using the Hypergeometric distribution function in EXCEL.  You can check my computed p-values for the exit poll results using this formula.

The Hypergeometric distribution is used to determine the probability (p-value) of getting a random sample, drawn without replacement, as extreme or more so given the population that the sample is drawn from.  If that wording sounds unnecessarily complex, I sympathize. Unfortunately, precision is often complicated to articulate.  This definition is hard to parse and you need a working knowledge of what the statistical terms and phrases mean.

“With” versus “without” replacement is an important descriptor of a random sample.  A situation with replacement is akin to selecting a card from a deck, then returning it back to the deck before drawing another card. Without replacement is selecting a second card from the 51 remaining in the deck.

This nuance in the drawing of the sample affects the basic assumptions statisticians build equations from. Different statistical distributions have been developed to handle the two situations.  Because voters were only asked once to fill out our survey, the exit poll sample is ‘without replacement’ and the Hypergeometric distribution is the most appropriate choice for testing the size of the errors.

Another important and relevant statistical concept:  One-sided and Two-sided tests.

Most distributions, including the Hypergeometric distribution, have the majority of data crowded around the average and the data gets sparser the farther away from the average. This type of distribution has ‘tails’.  There are the two directions of tails relative to the average value: upper and lower.

Tails of a distribution

When we perform a statistical test, we are looking at the deviations from what is expected given the underlying distribution of the data.  In some cases, we may only be interested in deviations in a particular direction – high or low.  In those cases, we can increase the precision of our test by only looking at one end of the distribution. This is called a one-tailed test.

In other situations, we are interested in differences in either direction, so we are examining both the upper and lower tails of the distribution.  In our exit polling data, we are looking at the deviations both positive and negative, to determine if either are unusually large.  Therefore, it is a two-sided test.

The EXCEL HYPERGEOM.DIST function computes only the lower tail p-value.  This result can be manipulated to find the upper tail probability. Both need to be computed. This EXCEL function requires five inputs:

  1. Sample Success – This is the total number of exit poll surveys for the candidate in that race at that polling place using that voting mechanism.
  2. Sample size – This is the total number of usable exit poll surveys from voters for that race at that polling place using that voting mechanism.
  3. Population success – This is the total number of voters for the candidate in that race at that polling place using that voting mechanism.
  4. Population size – This is the total number of voters for that race at that polling place using that voting mechanism.
  5. Cumulative – Input 1. This is a technical detail of the statistical test.  A zero will result in the probability of getting exactly the results we input, no more and no less.  Putting a one here gives the lower tail probability, which is what we want.

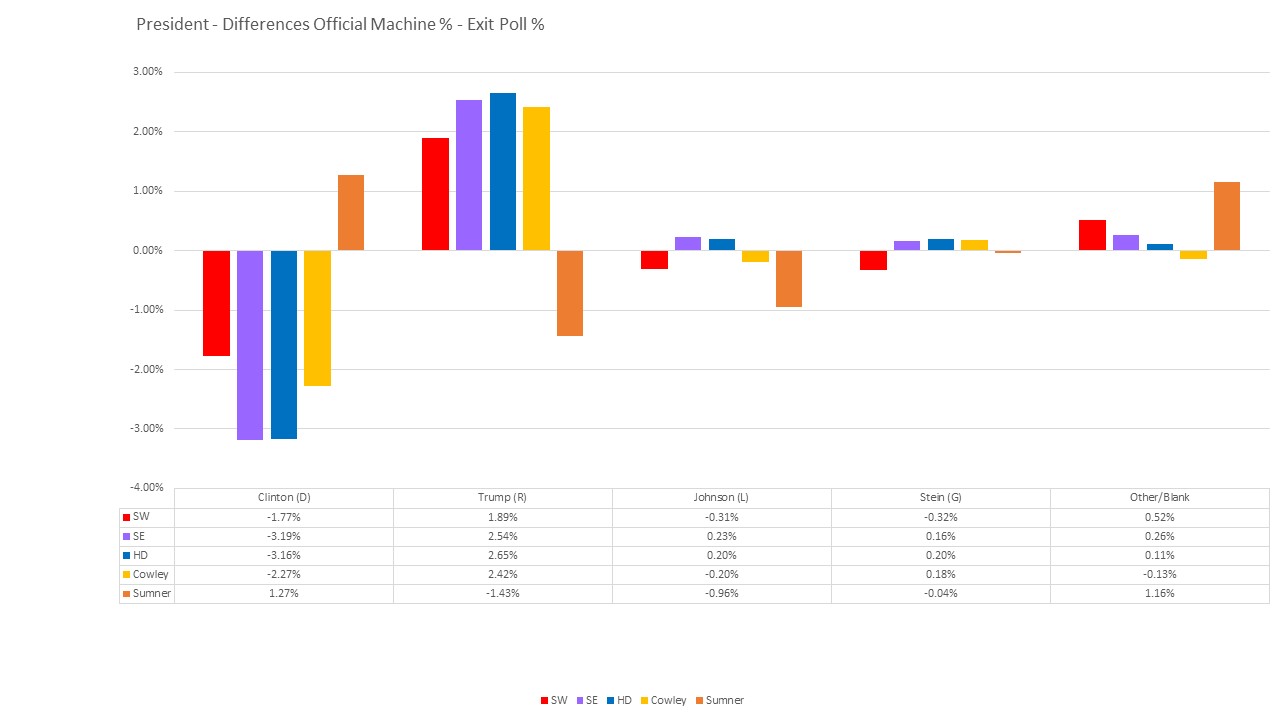
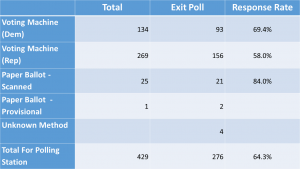
EXAMPLE:  Hillary Clinton received 435 votes out of 983 cast on the voting machines at the SE site.  That’s a 44.25% vote share.  Our exit poll data showed Hillary Clinton received 306 votes out of 645 survey responses to this question from voters who cast their votes on those same machines at that polling location.  That’s a 47.44% vote share.  The difference between those two values, -3.19%, is the error. This error measurement is computed for each candidate, race, type of voting equipment and polling location.

Use EXCEL function HYPERGEOM.DIST with the following inputs:

  • Sample_s = 306
  • Number_Sample = 645
  • Population_s = 435
  • Number_pop = 983
  • Cumulative = 1

Lower Tail P-value for Clinton, Machine Votes, SE Wichita

= HYPERGEOM.DIST(306,645,435,983,1) = 0.9979

Whoa!!  I thought you said Hillary got cheated?  This result is a near certainty.

That’s because our exit poll sample had a larger percentage of Hillary voters than the official results did.  Her exit poll results lie in the upper tail of the distribution, well above the official average.  We just computed the p-value for the lower tail i.e. the probability of randomly getting as many Hillary votes as we did (306) or LESS.

Next we need to compute the probability of randomly getting as many exit poll votes as she did or MORE.  The upper tail of the distribution.  Through the magic of math, we can find the upper tail probability with a modification to this function.

Subtract 1 from our sample size and compute the lower tail probability for that sample size.  Then subtract that lower tail probability from 1 to get the correct upper tail p-value.

Upper Tail p-value for Clinton, Machine Votes, SE Wichita

= 1.0 – HYPERGEOM.DIST(305,645,435,983,1) = .00325

Finally, because we did not specify in advance what direction we expected to see, this is a two-tailed test.  For two-tailed tests of this nature, the p-value is computed as double the minimum one-tailed p-value, capped at 1.0.

Two-tailed p-value for Clinton, Machine Votes, SE Wichita = 2*0.00325 = 0.0065.

Finally, putting it all together in one cell, nesting the needed functions:

Two-tailed p-value for Clinton, Machine Votes, SE Wichita

   =2*MIN(+HYPGEOM.DIST(306,645,435,983,1), 1-HYPGEOM.DIST(305,645,435,983,1), 0.5)


Picture from http://www.ats.ucla.edu/stat/mult_pkg/faq/pvalue1.gif

Exit Poll Data

This post contains links to the citizens’ exit poll survey forms and results.  I will post the analysis of those results separately.

There were five sites sponsored by the Show Me The Votes Foundation. Each site was independently run by voters from that area.  I provided guidance and instructions as well as training for volunteers.  You can learn more about how these exit polls were set up and run here How to run an exit poll.  Polls were manned the entire time the polling station was open. Voters were asked personally to participate; responses were kept anonymous.

The site managers were all amazing.  We got excellent response rates.  This study and these results would not have been possible without their help and the help of the dozens of other volunteers who were willing to take a few hours out of the day on Nov 8th to man my exit polls.  Thank you all.

I ran the Southeast Wichita site.  The questionnaire I used is the basic form that the others were built off of.  All questions on that form were common to all five sites.  There were no questions on races specific to my polling location.

Wichita Exit Poll Survey Form

Southeast Wichita Exit Poll Results

The Sumner County site was run by Glen Burdue in Wellington KS.  He modified his survey to add some additional questions specific to his polling location.  We had relatively few volunteers in the Wellington location, but he made up for it with dedication to the project.  Glen spent considerable time notifying and clarifying his exit poll with the county officials not to mention collecting surveys all day long on Nov 8th. Then he counted all the surveys himself, no small task by itself.

Sumner County Exit Poll Survey Form

Sumner County Exit Poll Results

The Cowley County site was run by Pam Moreno of Winfield KS.  She is an amazing organizer and and is a leader in the Women for Kansas – Cowley County chapter.  We ran a volunteer training session one October evening.  Her group also added a few questions to our basic survey that were specific to Winfield.  She also got volunteers to help do the counting the next day and professional help with the data input into my spreadsheet for analysis.

Cowley County Exit Poll Survey Form

Cowley County Exit Poll Results

The  Urban Wichita site was run by Lori Lawrence at the Health Department on 9th Street.  She did a phenomenal job, doing everything from baking cookies to attract voters to respond to getting buttons printed up for our volunteers to wear.  In our planning meetings, she made many excellent suggestions for ways to improve our exits polls.  She ran the same basic questionnaire that I did at the Southeast Wichita site.  She also did the complete first count on all her surveys.  With 883 useable surveys, that was a huge chore!

Urban Wichita Exit Poll Results 

The Southwest Wichita site had two co-managers, Lisa Stoller and Leah Dannah-Garcia, two excellent ladies who were devoted to accomplishing this.  They collected 1,435 usable surveys, a response rate to eligible voters of 80%.  Fantastic.  Counting all those surveys was a daunting task.  I dare say that aspect of it was as difficult for those extroverts, who were so excellent at running the exit poll, as the task of walking up to strangers and asking them to fill out a survey form was for introverts like me.  They needed help.  I ended up parceling them out to other volunteers as it was an overwhelming task, even for a veteran survey counter like myself.

SW Wichita Exit Poll Survey Form

SW Wichita Exit Poll Results

Exit Poll Results – Machine Vote Counts were Altered in S.E. Kansas

The Show Me The Votes Foundation sponsored five citizens’ exit polls in S.E. Kansas to assess the accuracy of machine vote counts.  The results of these citizens exit polls provide tangible evidence of election fraud in the presidential race.  I designed the exit polls explicitly so they would provide evidence of election fraud should any be present. The only better evidence would be an audit showing the discrepancies in the actual ballots.  But audits of the voting machine results are not allowed in these Kansas counties.

Exit polls – taken as people are leaving the polling place – are extremely accurate at capturing the vote share of candidates. Staffed by volunteers from the polls open to their close, we achieved outstanding response rates. These are shown in the table below.


eta: after final counting, the SW Wichita votes for Trump changed from 609 to  611.  

Polling Station and Exit Poll Results

Polling Station and Exit Poll Results

A rule of thumb is that 2% or larger difference in vote share between the official results and the exit poll is evidence of election fraud worth investigating.  We had such excellent response rates at some of our sites that differences significantly smaller than 2% are considered suspect in some races.

In addition, we can take into account the overall composition of differences between the official results and the exit poll statistics for each site.  For example, at the Wellington polling site in Sumner County, all Republican candidates had lower vote share in the machine counts than in the exit polling results.  This consistency is suspicious even though the differences may be small.

The exit poll results indicate that our machine generated counts are being manipulated. Polling sites in Sedgwick and Cowley counties were manipulated for the benefit of some candidates, most notably Trump at all four of those sites.  Results in Sumner County appear to be manipulated to the detriment of Republican candidates – but not necessarily to the benefit of Democrat Candidates.  Libertarians performed better in the machine counts for both the Senate and the 4th District races than exit polls indicated for all five sites.  These differences are not sizable enough to alter the outcome of most races, but they are consistent and larger than expected by chance alone.  I’ll post more about those results as I do a more detailed analysis for each polling location.

Presidential Race Analysis:

Votes for Hillary Clinton were shifted to Donald Trump in four of the five polling locations we surveyed, Sumner being the exception.  This chart shows approximately 2% to 3% of the machine votes were shifted from Clinton to Trump at those sites, adding 4% to 6% of the vote share to the difference between them to benefit Trump.   The other candidates show only normal error rates.


Machine Votes and Exit Poll Vote Share Differences

Figure 1 –  This graph shows the difference between the machine vote share and the exit poll vote share  for each candidate at each site.  Positive values show that the machine count benefited that candidate.  Negative numbers indicate a loss compared with the Exit Poll results.

Sites in Sedgwick and Cowley Counties show a distinct bias with the machine counts siphoning votes from Clinton and benefiting Trump.  Sumner County exit poll results for the Clinton and Trump were not statistically significantly different from the machine counts for Sumner County.

Since Trump won Kansas with 54% of the vote to Hillary’s 36%, even assuming this shift held across Kansas (it didn’t), it was well below Trump’s margin of victory, so this manipulation of votes did not alter the outcome. Still, it is disturbing evidence that the machine vote counts are being altered. In other states, which use similar equipment, manipulation at this level could have changed who won the Presidency.

Statistical Details

I computed the exact probability of each candidate getting the vote share they received in our exit poll given the official counts for that polling location.  This was computed using the Hypergeometric probability distribution, which takes into account both the size of our exit poll sample and the number of people who cast votes at that polling location on Election Day.

This probability – or p-value – is the exact computation of the probability of getting our exit poll results assuming no election fraud occurred.  The p-values for the different presidential candidates at each of the five exit poll sites are given in the table  below.

P-values for Exit Poll results of Machine Votes in Presidential race

The p-value represents the level of concern about the official results given our exit poll results with 1.0 indicating everything’s normal, nothing of interest here and zero indicating Red Alert  Danger Will Robinson! Danger! The computed p-values always fall somewhere in-between.

The probabilities for Johnson and Stein  are all quite reasonable and raise no serious alarms regarding the accuracy of their vote counts.  The probabilities for Clinton and Trump, on the other hand, are low enough to sound alarms for four of the five polling locations.

These exit poll results more than justify a call to audit the voting records and a profound skepticism in the results of machine counted votes.

The Cumulative Vote Share (CVS) Model is Validated as a Sign of Election Fraud

The math underlying this model dictates that this trend should level off horizontally, not start moving in the opposite direction.  It means the trend is not random chance, but due to a specific cause correlated with precinct size. It is such unanticipated trends as revealed by this type of graph that motivated me to look more closely into our vote-counting process, eventually leading to conducting the exit polls in this past election.

cvs-pres-sedgwick-countyThis is CVS graph for Sedgwick County. It shows Trump getting an increase of ~2% of the total vote share and Clinton losing that same amount from their respective inflection points at around 93,000 cumulative votes.  These exit poll results vindicate the use of the cumulative vote share model in assessing probability of election fraud.


Exit poll went well; no significant signs of election fraud.

With help from nearly a dozen volunteers, I conducted an exit poll on one polling location during this primary. It even made the local newspaper.  I am quite pleased with the results; everything went smoothly.

It was primarily meant to be trial run for the Nov. election, making sure that I will be able to collect the data necessary then to identify problems with our machine counts.  While some mistakes were made (all by me – the volunteers were fantastic!), I feel confident that we will be able to accomplish that task in Nov.

I know that many people are interested in the results of this survey.  Overall, things looked good.  There were a couple of yellow flags, but nothing I would recommend taking action on.

Data Collected: The primary question I asked was how the individual had voted, by machine, with a scanned paper ballot, or with a paper provisional ballot: Aug 2 Exit Poll Ballot

The exit poll was conducted at one polling location with survey responses being compared to the machine tabulated results at the polling location. Respondents were asked how they voted, by machine, or a scanned paper ballot or a provisional paper ballot. Results are shown below. Due to the small number of paper ballots, both scanned and provisional, analysis results are shown for the machine tallies and for the totals for the polling location, but not for the paper ballots separately.  The count of votes counted and survey collected is shown below in table 1.

Table 1:

Analysis Table 1


There is a discrepancy between the official count for provision ballots (1) and the exit poll count (3).  This is likely due to errors in marking the exit poll, so I am not concerned about this discrepancy.

There were an additional 47 surveys collected that were unusable due to problems that ranged from being completely blank to responses filled in for all races, both Dem and Rep

We asked about six races with two candidates, three races in each party.  However, only three of those races were applicable to everyone who voted at that location.  There were multiple (5) precincts voting at the polling location. Three of the races asked about were limited to voters in only one or two of those precincts.  As a result, survey takers could indicate a choice in those three races even if they did not actually vote on them.  For that reason, I have labeled the data collected on those three races  as ‘questionable’.   Caution should be used in drawing conclusions from the exit poll data for those races.

The results for the six races are as follows with the winners names bolded in table 2.

Table 2:

Analysis Table 2

Assuming that the official results were accurate, I computed the probability of our exit poll results using the binomial distribution.  I rated those results as being Green (looks good), Yellow (suspicious but not conclusive) or Red (definitely something wrong).  The usual threshold for statistical significance is below 5%. There were no red flags, but two of the six races got a yellow caution rating.   These results are shown in Table 3.

Table 3:

Analysis Table 3

Races that all survey respondents voted on were the U.S. Senate (Dem and Rep) and the U.S. Rep (Dem).  Results for the losing candidates are shown in Figure 1.


Figure 1:

Analysis Figure 2

The Senate Race for Dem candidates is given a yellow warning because the probability of the differences between the official results and our exit poll is only 3%.  This is not considered a red flag because we are making 12 different comparisons, which needs to be included in assessing the results. For example, if 12 comparisons are made using a 5% threshold, there is a 45.96% probability of at least one of them falling below that threshold by random chance.  There’s a whole set of statistical techniques designed to account for multiple comparisons if I wanted to get really precise about it.  In addition, while the official votes skewed towards Ms. Singh, she lost the statewide election so even if there was manipulation, it would not have affected the outcome of the race.

We had no method to identify what precinct people were in, so for the Kansas House and Senate races, survey takers could vote for someone who was not on their precinct’s ballot.  For this reason, the exit poll data must be considered questionable.   On the Republican side, since no precinct voted on both the house and senate races, the 38 surveys with both those races marked were not included in the totals for those two races.  Results for the losing candidates of these races are shown in Figure 2.

Figure 2:

Analysis Figure 1

The official results for Kansas Rep. Dist. 87 race get a yellow rating.  The results were skewed towards Mr. Alessi with only around a 1% chance of occurring by random chance.  This is not rated as red because the exit poll data was questionable.  However, since Mr. Alessi lost the election, even if there was manipulation, it would not have affected the outcome of the race.

THE THEATER IS ON FIRE!

This post is in response to this article at Nation.com.

 Reminder: Exit-Poll Conspiracy Theories Are Totally Baseless Voters have good reason to lack confidence in our election systems. But claims of widespread fraud aren’t going to fix anything

Sadly, this author does not understand the math well enough to realize that, despite the protests of the professional pollster interviewed, claims of widespread fraud are not baseless. Exit poll results for the democratic presidential primary provide not one but two solid pieces of evidence in the case for widespread election fraud.

We have a voting system, as he acknowledges, that gives us no cause for confidence that our voting results are accurately assessed. Despite this, he claims that there is no cause for concern. I disagree as I find multiple independent paths of analyses give evidence that consistently points to massive widespread election fraud across our country.

My specialty is statistics and I’ve pulled down publicly available data independently, analyzed it myself, and corroborated analyses which points to massive widespread election fraud. Mr. Holland disparages the mathematical work of Richard Charnin*, but I have not found an error in any of the analyses of his that I have repeated.

In particular, his assessment of the binomial probability regarding the likelihood of the exit poll results, is both accurate and appropriate. I have verified it myself. This binomial analysis was ignored by Mr. Holland in favor of criticizing a different approach that was also used. That approach is also sound, but I have not reproduced those calculations. That both models show results that are consistent with the hypothesis of election fraud is more than doubly damning.

If we assume no election fraud, then the two different types of analysis of the exit poll errors are unrelated because one analysis looks at the size of the error while the other is based on whether it benefited Hillary versus Bernie. That they are both consistent with fraud could be considered a third piece of evidence in support of that hypothesis.

The excuses Mr. Lenski, Edison’s executive vice president is quoted as providing are specious with regard to the magnitude of the anomalies we are seeing. Yes, there are issues that can lead to inherent problems due the different ways they performed the surveys. No, those reasons are not sufficient to explain the anomalies we are seeing across the country.

There are only two possibilities – a) Bernie supporters are more likely to respond to the poll or b) there is widespread election fraud altering election results in favor of Hillary across the U.S.

While we can never completely eliminate reason a, Mr. Lenski’s excuse is no more than a restatement of that first hypothesis while he notes that there is a a lower response rate (how much lower?) for the more detailed surveys conducted in the U.S. While it’s easy for the mathematically naive to infer causality from his statement, that isn’t automatically the case. Further, it’s not an assumption that should be made without explicitly stating it**.

So which do you think is more likely across the U.S.: Are Bernie voters just more civic-minded and willing to participate in exit polls than Hillary voters or is some well-organized group of wealthy individuals able to successfully conspire to fix voting machines across the nation or are multiple independent local political actors across the country taking advantage of the non-transparent hackable voting systems?

While you contemplate those options and estimate the probability of the first hypothesis with respect to the last two, let me review some of the additional evidence in support of the hypothesis of fraud.

Cumulative Vote Share (CVS) analysis pioneered by Francis Choquette shows problems across the nation for the past decade or more. Interestingly enough, places that use hand counted ballots do not show the same trends and within a state, analyzing by machine can show sharply different trends for different equipment. Such analysis shows trends that are indicative of rigging that favors Hillary

The apparent ease of hacking electronic voting machines combined with the prevalence of election rigging through-out the world and human history.

Lack of basic quality control procedures: In most locations in the U.S., no one – not officials and not citizens – actually verify the official vote counts. Canvassing becomes a sham that involves verifying that yes, the machine produced outcomes all add up to the machine produced totals. In those places where the count was supposed to be publicly verified, citizens watching report blatant miscounting to force a match to the “official results”. Their testimony to election commissioners about such actions were met with a blank stare followed by dismissal of their testimony.

I live in Kansas, home of Koch Industries and currently the reddest of red states with all public schools across the state on the verge of closing the end of this month. IMO these problems are due to election fraud. I believe the Governor, Senator Roberts, and most of the KS legislature would not have won in 2014 if a fair and honest vote count had been done.

I do not make that statement lightly. I hold a Ph.D. in statistics and have been certified as a Quality Engineer for nearly 30 years. I’ve gone to the extreme of filing a lawsuit requesting access to the voting machine records to verify those election results. So far, I haven’t been allowed access.

A few questions for Mr. Holland: Did you spontaneously decide to write about this? A reaction to a disparaging blog regarding a previous piece saying “don’t worry, the theater is NOT on fire” vis-a-vis election fraud. Or was it suggested? Assigned? Did your publisher encourage you to disparage these claims, despite your lack of expertise to regarding either surveys or statistics. Would a favorable opinion piece regarding such claims have been published?

Mr Holland, you have not done the analysis for yourself. You base your opinion of its significance on the expert opinion you trust – Mr. Lenski, an executive of the polling company. My response is that I have looked into this deeply and I trust my own expert opinion on this matter. It is a justifiable conclusion that widespread election fraud is going on in this country. The Theater is on fire. We need to take care of this problem now!

The fix, btw, is both easy and impossible. All we have to do is demand a transparent and accurate vote count from our election officials.

*He disparages him for writing about the murder of JFK. Is it really foolish to think that someone besides Lee Harvey Oswald was involved in that?

**It’s also a testable assumption, but Mr. Lenski’s firm is the only entity with access to the data to do the test.