Exit Poll Results – Machine Vote Counts were Altered in S.E. Kansas

The Show Me The Votes Foundation sponsored five citizens’ exit polls in S.E. Kansas to assess the accuracy of machine vote counts.  The results of these citizens exit polls provide tangible evidence of election fraud in the presidential race.  I designed the exit polls explicitly so they would provide evidence of election fraud should any be present. The only better evidence would be an audit showing the discrepancies in the actual ballots.  But audits of the voting machine results are not allowed in these Kansas counties.

Exit polls – taken as people are leaving the polling place – are extremely accurate at capturing the vote share of candidates. Staffed by volunteers from the polls open to their close, we achieved outstanding response rates. These are shown in the table below.


eta: after final counting, the SW Wichita votes for Trump changed from 609 to  611.  

Polling Station and Exit Poll Results

Polling Station and Exit Poll Results

A rule of thumb is that 2% or larger difference in vote share between the official results and the exit poll is evidence of election fraud worth investigating.  We had such excellent response rates at some of our sites that differences significantly smaller than 2% are considered suspect in some races.

In addition, we can take into account the overall composition of differences between the official results and the exit poll statistics for each site.  For example, at the Wellington polling site in Sumner County, all Republican candidates had lower vote share in the machine counts than in the exit polling results.  This consistency is suspicious even though the differences may be small.

The exit poll results indicate that our machine generated counts are being manipulated. Polling sites in Sedgwick and Cowley counties were manipulated for the benefit of some candidates, most notably Trump at all four of those sites.  Results in Sumner County appear to be manipulated to the detriment of Republican candidates – but not necessarily to the benefit of Democrat Candidates.  Libertarians performed better in the machine counts for both the Senate and the 4th District races than exit polls indicated for all five sites.  These differences are not sizable enough to alter the outcome of most races, but they are consistent and larger than expected by chance alone.  I’ll post more about those results as I do a more detailed analysis for each polling location.

Presidential Race Analysis:

Votes for Hillary Clinton were shifted to Donald Trump in four of the five polling locations we surveyed, Sumner being the exception.  This chart shows approximately 2% to 3% of the machine votes were shifted from Clinton to Trump at those sites, adding 4% to 6% of the vote share to the difference between them to benefit Trump.   The other candidates show only normal error rates.


Machine Votes and Exit Poll Vote Share Differences

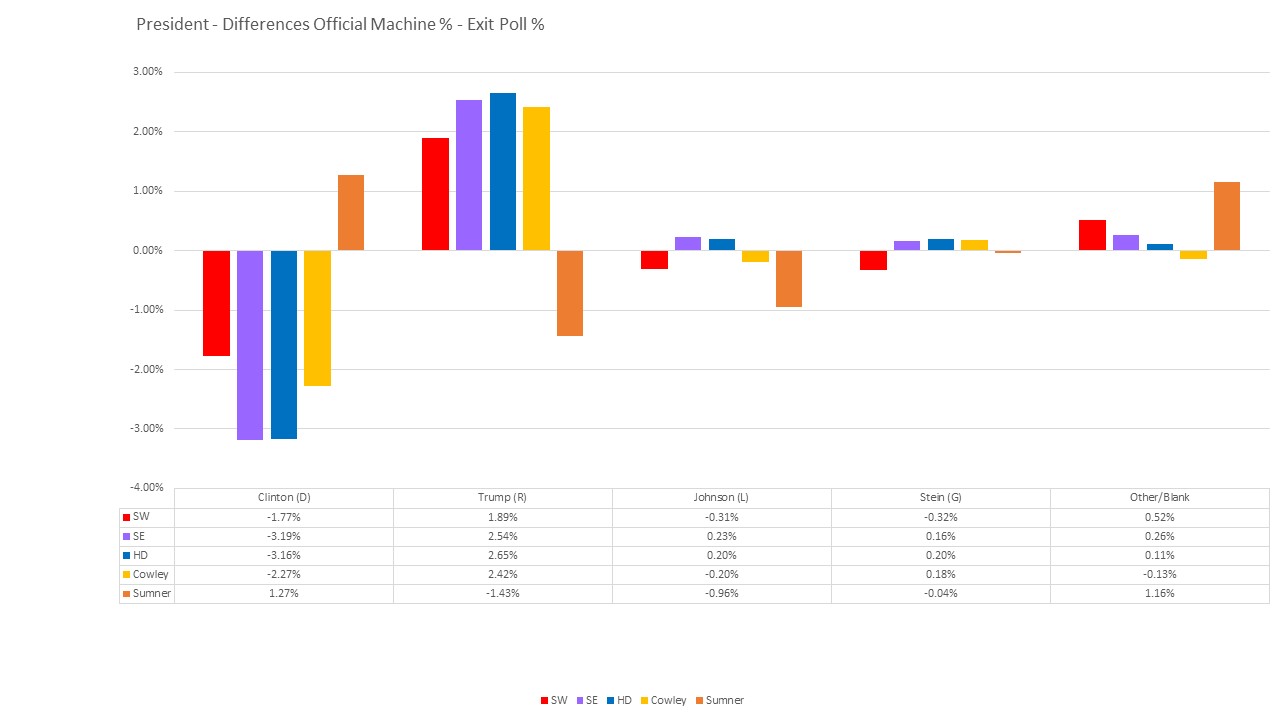
Figure 1 –  This graph shows the difference between the machine vote share and the exit poll vote share  for each candidate at each site.  Positive values show that the machine count benefited that candidate.  Negative numbers indicate a loss compared with the Exit Poll results.

Sites in Sedgwick and Cowley Counties show a distinct bias with the machine counts siphoning votes from Clinton and benefiting Trump.  Sumner County exit poll results for the Clinton and Trump were not statistically significantly different from the machine counts for Sumner County.

Since Trump won Kansas with 54% of the vote to Hillary’s 36%, even assuming this shift held across Kansas (it didn’t), it was well below Trump’s margin of victory, so this manipulation of votes did not alter the outcome. Still, it is disturbing evidence that the machine vote counts are being altered. In other states, which use similar equipment, manipulation at this level could have changed who won the Presidency.

Statistical Details

I computed the exact probability of each candidate getting the vote share they received in our exit poll given the official counts for that polling location.  This was computed using the Hypergeometric probability distribution, which takes into account both the size of our exit poll sample and the number of people who cast votes at that polling location on Election Day.

This probability – or p-value – is the exact computation of the probability of getting our exit poll results assuming no election fraud occurred.  The p-values for the different presidential candidates at each of the five exit poll sites are given in the table  below.

P-values for Exit Poll results of Machine Votes in Presidential race

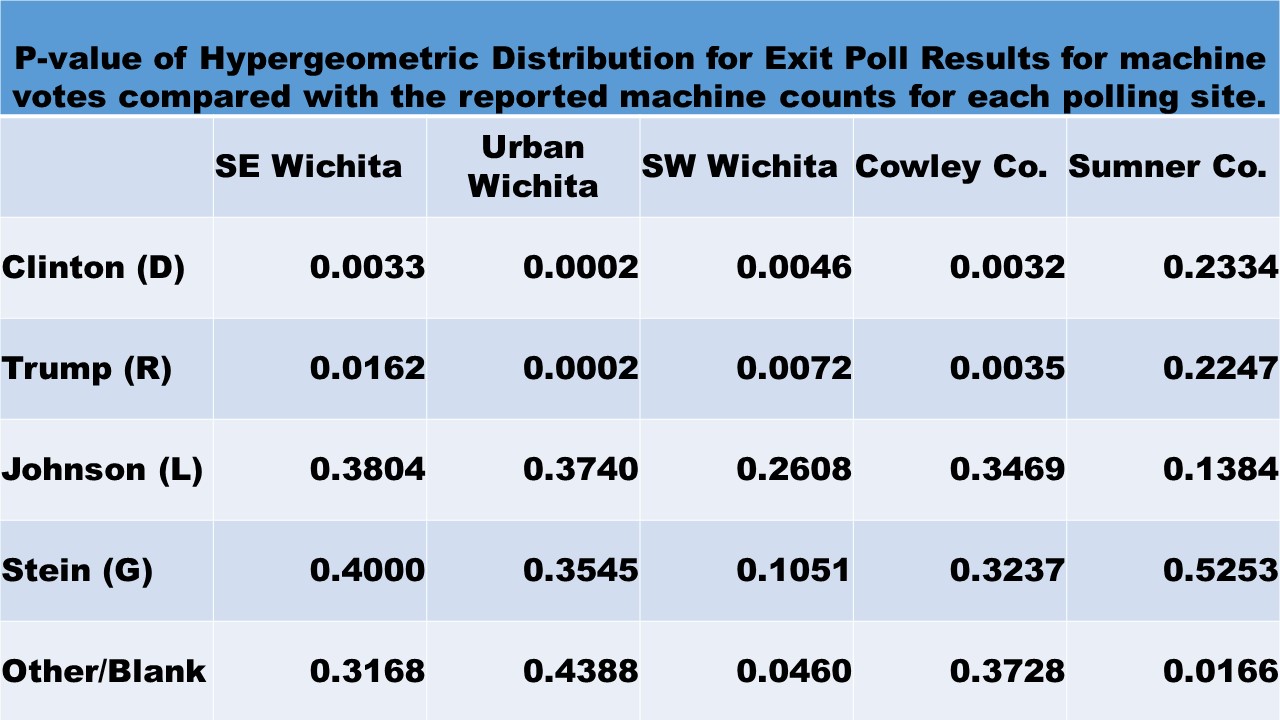
The p-value represents the level of concern about the official results given our exit poll results with 1.0 indicating everything’s normal, nothing of interest here and zero indicating Red Alert  Danger Will Robinson! Danger! The computed p-values always fall somewhere in-between.

The probabilities for Johnson and Stein  are all quite reasonable and raise no serious alarms regarding the accuracy of their vote counts.  The probabilities for Clinton and Trump, on the other hand, are low enough to sound alarms for four of the five polling locations.

These exit poll results more than justify a call to audit the voting records and a profound skepticism in the results of machine counted votes.

The Cumulative Vote Share (CVS) Model is Validated as a Sign of Election Fraud

The math underlying this model dictates that this trend should level off horizontally, not start moving in the opposite direction.  It means the trend is not random chance, but due to a specific cause correlated with precinct size. It is such unanticipated trends as revealed by this type of graph that motivated me to look more closely into our vote-counting process, eventually leading to conducting the exit polls in this past election.

cvs-pres-sedgwick-county
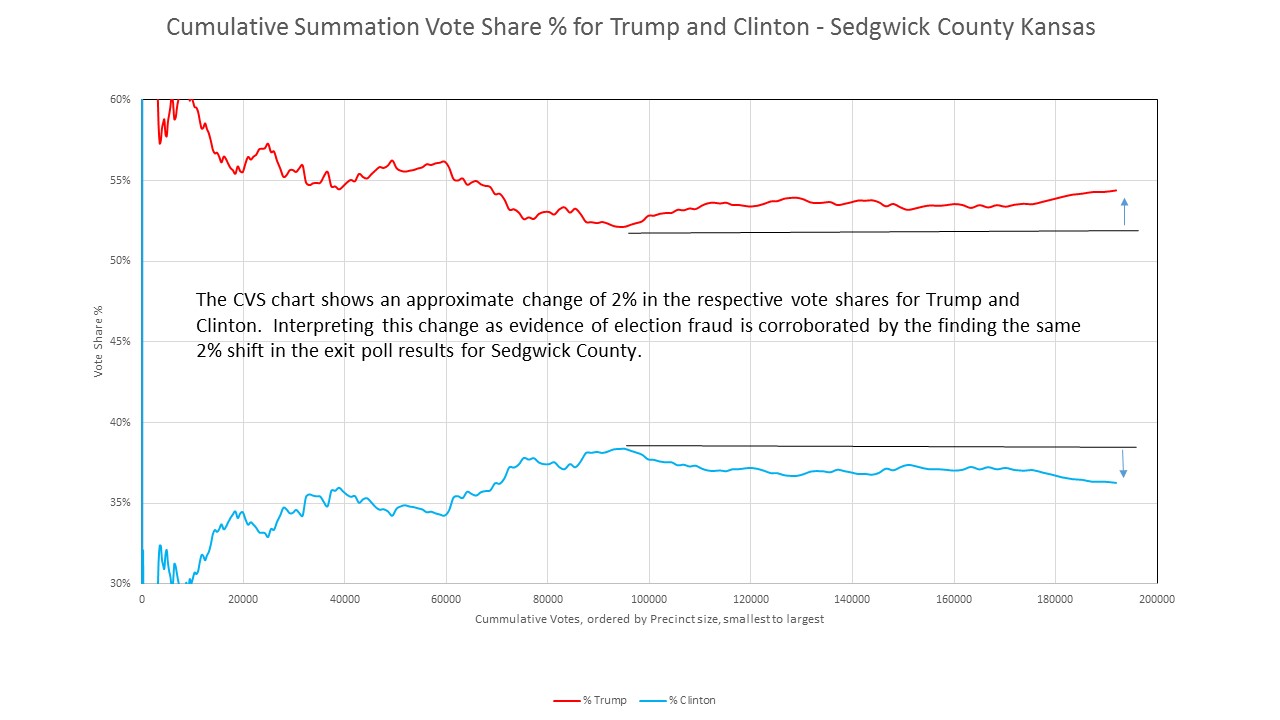
This is CVS graph for Sedgwick County. It shows Trump getting an increase of ~2% of the total vote share and Clinton losing that same amount from their respective inflection points at around 93,000 cumulative votes.  These exit poll results vindicate the use of the cumulative vote share model in assessing probability of election fraud.


Exit Polling Report

We ran a total of five exit polls Tuesday, three in Wichita.  We were outside, so we were hoping for fair weather.  Although the morning started out damp and dreary, it was nice most of the day, albeit a bit chilly after dark.  Setting up to be operating at 6:00 and running until the close of polls made for an exhausting day although I managed a nap in the early afternoon.  Everything went fairly smoothly at all locations.  In SE Wichita, we gave away 10 dozen donuts before 9:00 am with candy after that to bribe voters to talk with us.  I had to make a run for more candy at 4:00, but no major impediments or problems at the S.E. location.

The most interesting thing that happened was regarding a young black woman who had declined to participate in our exit poll.  Later that evening, near to the polls closing, she was back.  Apparently her mama had voted there early that day and filled out our survey.  She had insisted her daughter return to do so. I was delighted!  That young woman has a mama who cares about her and about making her voice heard by voting.  I wanted to thank her and tell her she’s an awesome mom!  But I was too busy handing out survey forms to other voters.  We had excellent participation rates!

I took both Tuesday and Wednesday off work, and was able to spend all day counting ballots Wednesday.  I’m also an experienced survey counter, so I managed to get the 925 surveys organized and counted by the end of the day.

My volunteers are working together to get the other sites counted, but they have other things to do too.  Altogether, we have collected thousands of exit poll surveys.  Counts are continuing even as I write this.  That I want the surveys from each site to have two independent counts doesn’t make the task any easier.

I also need to verify the results we wrote down at the polling stations, but was informed today that they won’t be available until after the canvassing is complete, approximately a week to ten days from now.  I’m glad I asked my site managers to get the totals that night from their polling stations.  I can go ahead and work on my analysis, updating it with any corrections needed when the data is available.  But I’ll hold off publishing the results until I can verify the numbers.

I will share some general stuff from my initial numbers for my site with the caveat that these results are considered preliminary until the data has been verified.

The scanned paper ballot official counts and our exit poll results are close, with nothing falling outside reasonable statistical bounds on any of the races.

The voting machine counts and our exit poll results are not as close, with a couple of results that bear looking into, but I had three results flagged earlier.  One has already turned out to be a data input error on my part.  (That’s why I want to verify the numbers before publishing).

I will present the exit poll provisional ballot results though.  I’m reasonably confident there are no large errors in my counts and small changes won’t alter these results.

In general, people who had voted provisionally were more likely to have time to take our survey.  We had 79 out of 92 provisional voters fill out our survey for a response rate of over 85%, nearly 20% higher than the 66% response rate of voters whose ballots were counted that day.

rep-share-of-provision-versus-counted-exit-poll-ballots-countrysideIn our exit poll survey, I found that provisional voters were approximately 10% less likely to vote for republican candidates.  I think it is reasonable to take this along with the additional data from the other exit poll locations, as a measure of the effectiveness of Kris Kobach’s efforts to disenfranchise non-republican voters.  I have already contacted the league of women voters to see if this data will be of help with their lawsuit regarding his practices.


Analyzing Exit Poll Results

It’s important to state up front what data will be collected, what analysis to perform on that data and what constitutes evidence of a serious problem versus random errors in any poll of this nature.

Polling stations allow voters access to the results after the polls are closed when the votes have been tallied.  In Sedgwick County, they will have separate reports printed for the electronic voting machines and the scanned paper ballots.

We will also get a count of the number of provisional ballots collected from the polling location.  Theseballots will not be opened until the voter’s registration is verified and there will never be an official tally of the provision votes for polling location.  But we can look at the results we have for voters who submitted provisional ballots and compare them with the votes that were counted at the polling location.  If there are significant differences, this is evidence of the voter suppression effect of Kris Kobachs voter registration rules.

I have created a general data collection and analysis EXCEL spreadsheet.  Multiple precincts vote at each polling location and the results are reported for each precinct, not the polling location, so I’ve set up a spreadsheet to sum the numbers up and compute the appropriate probabilities.

I will be customizing this EXCEL file for each exit poll location in Kansas, but I am happy to share a general version of this worksheet with anyone who is interested in running an exit poll for their own area.  All you will have to do is input the official results and your exit poll results.    This is an example of of the output.


Example Data Analysis
Presidential race Chi-Squared Result:  NA
Candidates Exit Poll Official Results Binomial Probability
Clinton (D) 52 60 0.0638
Trump (R) 38 30 0.0530
Johnson (L) 6 6 0.5593
Stein (G) 2 2 0.5967
Other 2 2 0.5967
Total 100 100

There are two different analyses than can be used in this situation.  The chi-square test will give an exact probability that the actual results differed from what would be expected under the assumption of random chance.  EXCEL has this test as a built in function: CHISQ.TEST.  But the chi-squared test has minimum data requirements which were not met in this example, hence “NA” or Not Applicable as the result of this test.

Since the chi-squared test will not work for every set of possible data, I also show the individual binomial probabilities for each of the candidate.  The minimum probability from this set of five computations is a reasonable approximation to the exact computation using the extension of the binomial distribution and can be easily computed using built-in Excel formula BINOM.DIST.

How to interpret this:

We judge the probability of machine manipulation of the vote by evaluating the probability of our results assuming no manipulation of votes is occurring.  This is referred to as the “null hypothesis”.  All probabilities shown are made under this assumption.  If this probability is above 0.05 (5%), we can reasonably conclude that the differences between the machine vote share and the exit poll vote share are typical of random variation due to the normal errors in the process.

If this value lies between 0.05 and 0.001, raise an eyebrow and give the numbers for that race a little extra scrutiny and consider it in concert with the other exit polling results.

If this values lies below 0.001, that is evidence of fraud.  Personally, I would like to see a recount of any race with results that fall this far from normal.  But only a candidate can request a recount in Kansas.

In this example, I have contrived to show Trump with a questionably low # of votes in the official count compared to the exit poll results.  Hillary has a slightly elevated value.  But these results are not unexpected as the minimum probability of results this far off is above 0.05.

But if the other sites have similar values and they are all benefitting the same candidate, it would be concerning.  If 2 or 3 sites out of 5 show the same beneficiary of the differences, that’s reasonable.  But if 5 out of 5 sites show the same beneficiary, it’s evidence of rigging.

If we see multiple races with low odds and the same slate of candidates are benefiting, we have solid evidence of machine manipulation of our official votes.  If we see only the normal expected errors, then we have solid evidence it is NOT being manipulated.

While a single location and a single race might show evidence of manipulation, savvy cheaters will try to avoid this method of detection by establishing a maximum shift that falls beneath the 0.05 probability results.  But looking at multiple races and sites, we can establish whether even small shifts show evidence of cheating.

We can define a slate of candidates by party and check the probability of getting the results we got using a similar binomial analysis.  Under the null hypothesis of no manipulation, the probability of an error that benefits a candidate is 50%.   There are three races with candidates and five judges we are asking about, for a total of 8 results for each polling location.  Governor Brownback would like to see 4 of the 5 judges lose their jobs and replace them.  We can also presume he supports the Republican Party candidates for President, Senate and Representative.

We will have data from 5 different locations for a total of 40 random samples with approximately 50% probability.  (For example, let X be the number of errors that were the opposite of the Brownback administration preferred candidates. If we have 40 random samples as defined above, the probability of getting errors in the opposite direction of his preferred result is computed with the following excel formula:  BINOMDIST(X, 40, .5, 1)

If this value is extremely low (less than .001), we conclude that the Republican Party has unduly benefited and further investigation would be appropriate.

How to interpret the Provisional Ballot Data:

We cannot know the final count of the provisional ballots collected at a polling location.  They are polled at the county level and only those that are shown to be registered voters are opened and counted.   What we can do is compare the results of the provisional ballots with the other responses to our exit poll.   If there is a major difference between those asked to fill out provisional ballots with the automatically counted votes, we have a measure of the effect of the voter ID laws and if it made a difference to the outcome.

For each race, we can use the chi-square test if we have sufficient data.   Otherwise, we can use the binomial approximation similar to the one used to compare the official count to the exit poll survey results.

electioneering and instructs them regarding what they can and cannot do.  While permission is not required to run an exit poll, we do need permission from the property owner to set up a booth to collect our ballots and provide chairs and shade for our volunteers.  Mainly, we want everyone to know what we are doing to avoid any issues arising on on election day.

How to Run an Exit Poll Part 1

How to Run an Exit Poll Part 2

Creating an Exit Poll Ballot

Creating an Exit Poll Ballot

This is part 3 of my “How-to-Run-an-Exit-Poll-Series.

The exit poll survey ballot is important, but not complicated. The only question of interest, other than their ballot choices, is the method of voting.   Data will be available at the end of the day with separate totals for the machine cast votes and the scanned paper votes.  There will be no official count of provisional votes at this station, so we can only compare those votes to overall total for the polling station. But that comparison allows us to evaluate whether the giving people provisional votes amounts to a voter suppression tactic.

Since space on our survey form is at a premium, and because including that information makes their response less anonymous, I do not recommend including questions about age, race or gender.  Generally speaking, you want to keep the words to minimum.  (Not an easy task for me.)

Here is an example survey I have developed for exit polls in Sedgwick Co.  I included a short paragraph at the top because I feel it’s important to let people know why you want this information and reassure them that results are anonymous, just like their vote.

Sample Exit Poll Survey

The first question is really too long, but I wanted to be as clear as I can about this question.  In Sedgwick County Kansas there are three possible options:  A vote cast via electronic voting machine, a paper ballot that the voter feeds into a scanner for on-site electronic counting or a provisional ballot – a paper ballot that is sealed into an envelop to be counted later (maybe).

Asking about the specific races is straightforward.  State the office and then list the candidates.  Circling answers reduces the need for a blank or box to check.  It saves space on the page.

Staggering the answers for questions with more than one line of answers (ex: Pres) makes it easier to discern the voters intent.  When they are stacked one above another, the answer may easily become ambiguous.

Since a single polling location will have multiple precincts voting there, it’s a problem asking about races where different precincts will be voting  for different candidates.   Generally, I want to confine the questions to races that will appear on every ballot at the polling location.   On the other hand, my site managers for the SW Wichita location are very interested in the county commissioner races.  We arrived at the following:

Who did you vote for your County Commissioner Race? (Select one for District 2 OR  District 3)   –  sw-wichita-nov-8-exit-poll-ballot

I have hopes that we won’t get too many voters identifying their choices for both district 2 and district 3, but I expect we will get some.   OTOH, it’s the only question that would be spoiled and I’m reasonably comfortable in assuming that such mishaps are equally likely to occur regardless of which candidate they support.  I think we will get good data from this exit poll.

How to Run an Exit Poll Part 1

How to Run an Exit Poll Part 2


How to Run an Exit Poll Part 2

Here are more instructions with links to help people who want to run an exit poll.  This is all pre-election day stuff to do but doesn’t include developing your sample survey form.  I’m going to devote a separate post to that.  I’ll link to it when it’s up.  I’m also planning an excel template that people can download, input their exit poll results and official polling location results to get an output of the probability of the difference between the occurring by chance alone.

Training:  I highly recommend running a short training session with your volunteers.  I think 30 minutes is sufficient, an hour if it’s a large group.   Go over the  instructions,  let them see the supplies (ballot box, survey forms, etc.), and have each participant go through some practice interactions with their fellow students.  It also gives everyone a chance to get acquainted prior to election day.

Schedule:  You’ll need to prepare a schedule in advance and co-ordinate with the volunteers to make sure they can and will be there for their appointed hours.   Here is the example-volunteer-schedule I used in my August primary exit poll.  Notice that some volunteers are tasked with bringing in fresh supplies.  Everyone got a copy of this ahead of time, so they knew when they were working and with whom.  Always have at least two volunteers manning the exit poll.  This is a basic safety precaution.  If one volunteer has a heart attack, the other will notice and call 911.

Tally Sheet:  You need a form for volunteers to record the number of refusals. Here is what I used in my August primary exit poll.  The time categories related to the hours different volunteers worked.  I taped a copy of this to the table and had the volunteers record their refusals.  Some volunteers kept separate tallies for themselves when it was busy and then later recorded them onto that page, which is also fine.

Supplies:  You’ll need to arrange for all supplies to be on site, including refreshments.  I had different volunteers bring refreshments through out the day. Suggested Supply List

Costs:   While many of the supplies are things you may already own or can be borrowed at no cost, printing hundreds of survey copies to be filled out will cost money.  I am estimating costs for the sites I am coordinating at $50 – $100 per site, including refreshments.

Another option is an electronic app.   I’m not using it for my sites because the advantage of voter marked hand-counted paper surveys is the same as for paper ballots.  On the other hand, I have donations sufficient to fund the needed supplies for exit polls I am coordinating, so my out-of-pocket costs are minimal.  If costs are a constraint, this is an acceptable alternative for the 2016 election.

 Permission Slip:  It’s not strictly required, but in addition to notifying the appropriate person regarding setting up your exit poll at their location, having documentation of permission by that person isn’t a bad idea.  I phoned and introduced myself, sent the person an email, and picked up the permission-slip in person weeks ahead of time.  I kept it on site at the exit poll.  No one confronted me about my right to be there, so it wasn’t needed.  But if someone does, it’s nice to have it.